
Subscriber retention
Learn how to use Recurly's Subscriber Retention dashboard to analyze cohort-based retention and churn trends for paying subscribers.
Prerequisites
- Users must have Analytics user role permission.
Definition
When you set an appropriate interval, subscriptions that start immediately after a previous subscription expires are counted as a single continuous subscription. This gives you a more accurate picture of activations and churn.
Key benefits
Key details
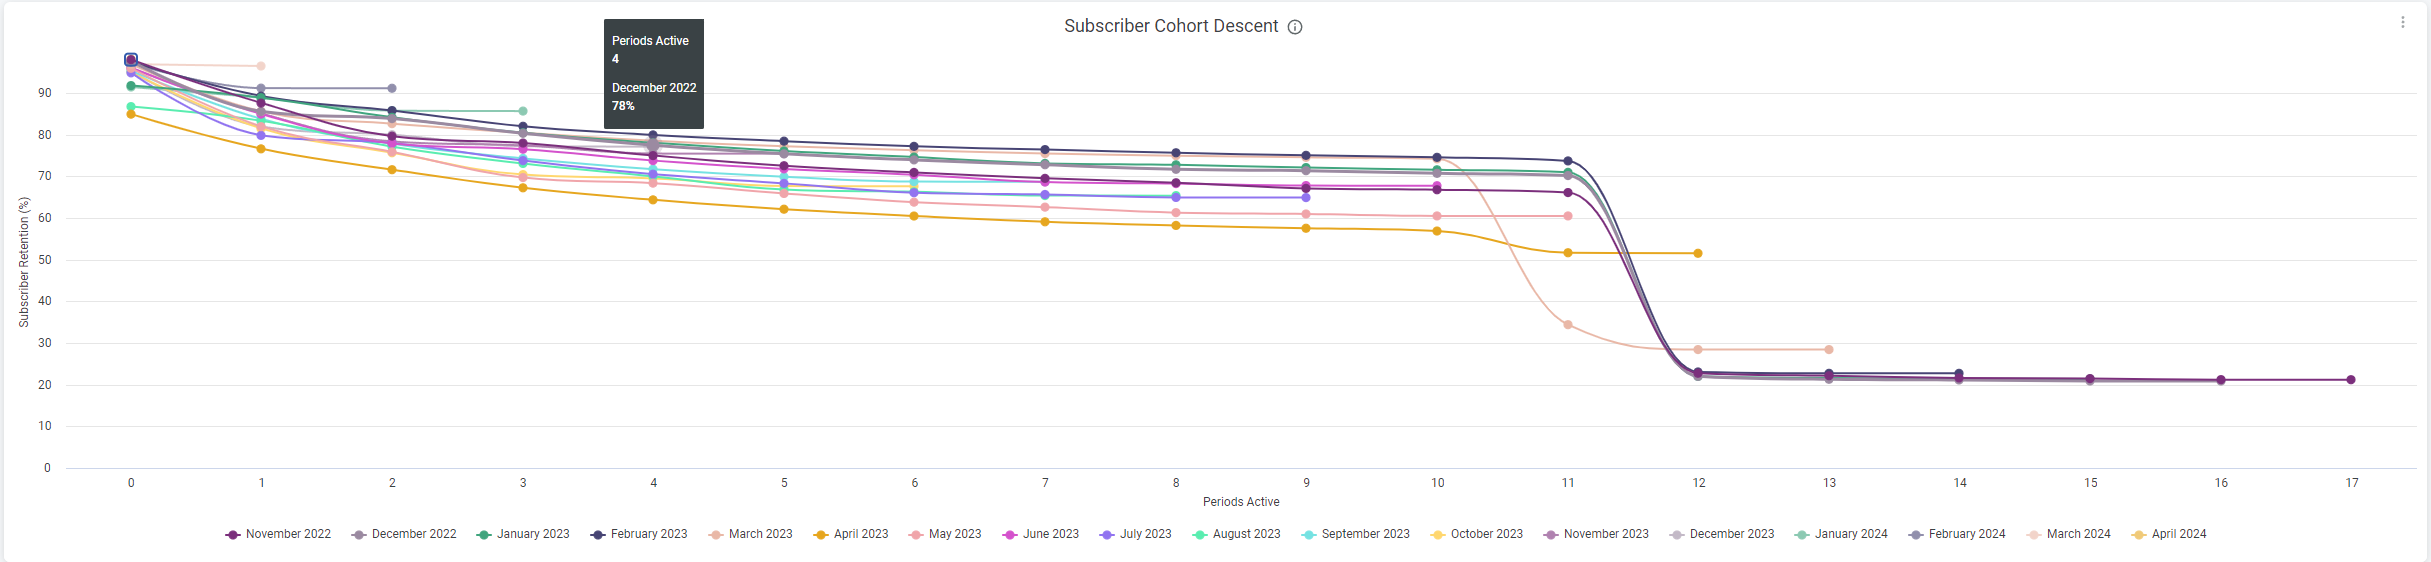
This section shows retention trends across your subscriber base using a Subscriber Cohort Descent line chart and detailed cohort analysis.
- The sign-up month is the month a new subscriber makes a payment greater than $0. Subscribers with a $0 invoice, or whose first paid invoice is overdue, aren't counted — a subscriber must successfully settle their invoice to be categorized in the "Paying Subscriber" cohort.
- Data excludes subscriptions under trial or those covered by a previously purchased gift card.
- Subsequent subscriptions purchased by an existing subscriber don't affect this dataset.
- A subscriber is considered retained if they have at least one active subscription, and churned if their sole or last subscription lapses. A subscription on hold isn't labeled as churned.
- Subscribers are counted in month 0 retention if they stay subscribed for a full month after sign-up. For example, a subscriber who joins on November 14th but leaves before December 14th is logged as a churn in month 0. One who leaves before January 14th is logged as a churn in month 1.
Filters

Subscriber filters
- All subscribers: Includes all accounts with a current or past active subscription.
- Paying subscribers only: Includes subscriptions where at least one successful payment has been made.
- Paying subscribers only (exclude refunds): Includes subscriptions with successful payments where the total payment amount, after refunds, is greater than $0.
- Non-paying subscribers: Includes subscriptions where no successful payments have been made, from activation through expiration.
- Trials: Includes subscriptions currently in their trial period.
Metric types
- Percent (% still active): The percentage of subscriptions that remain active.
- Active (# still active): The total number of subscriptions still active.
- Churned (# churned): The total number of subscriptions that have churned.
Subscriber retention
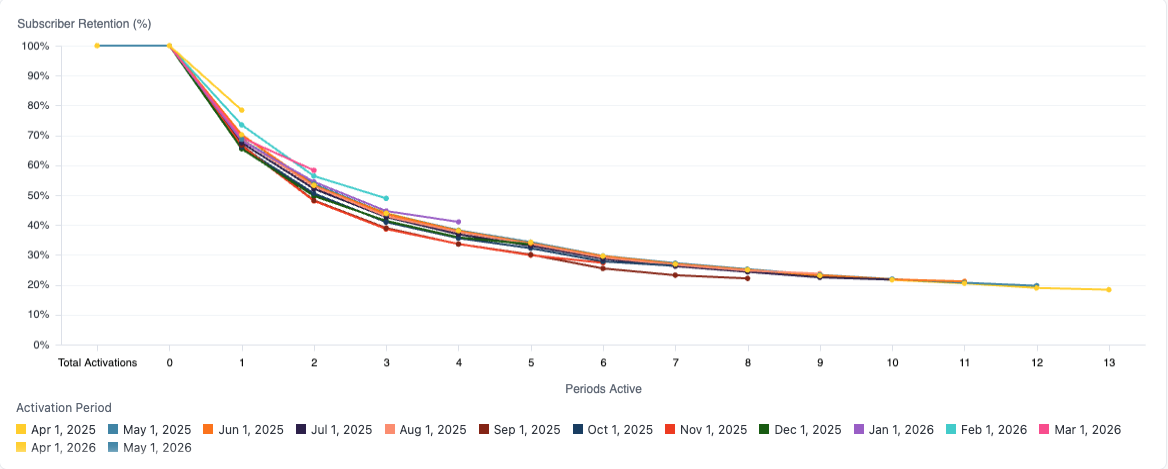
A line chart visualizing your subscriber retention rate based on the metric you choose — percentage, active status, or churn rate — across the specified period.
Subscriber retention analysis detail
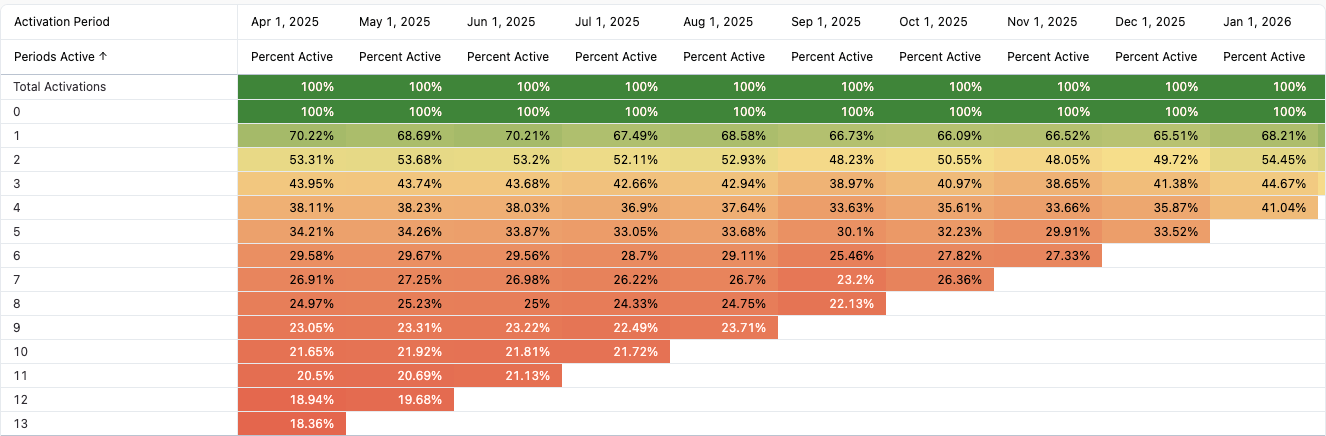
A deeper look at the retention figures of paying subscribers who signed up in a specific month. The snapshot below shows the month-by-month percentage of these subscribers, and you can download up to 100 columns of data.
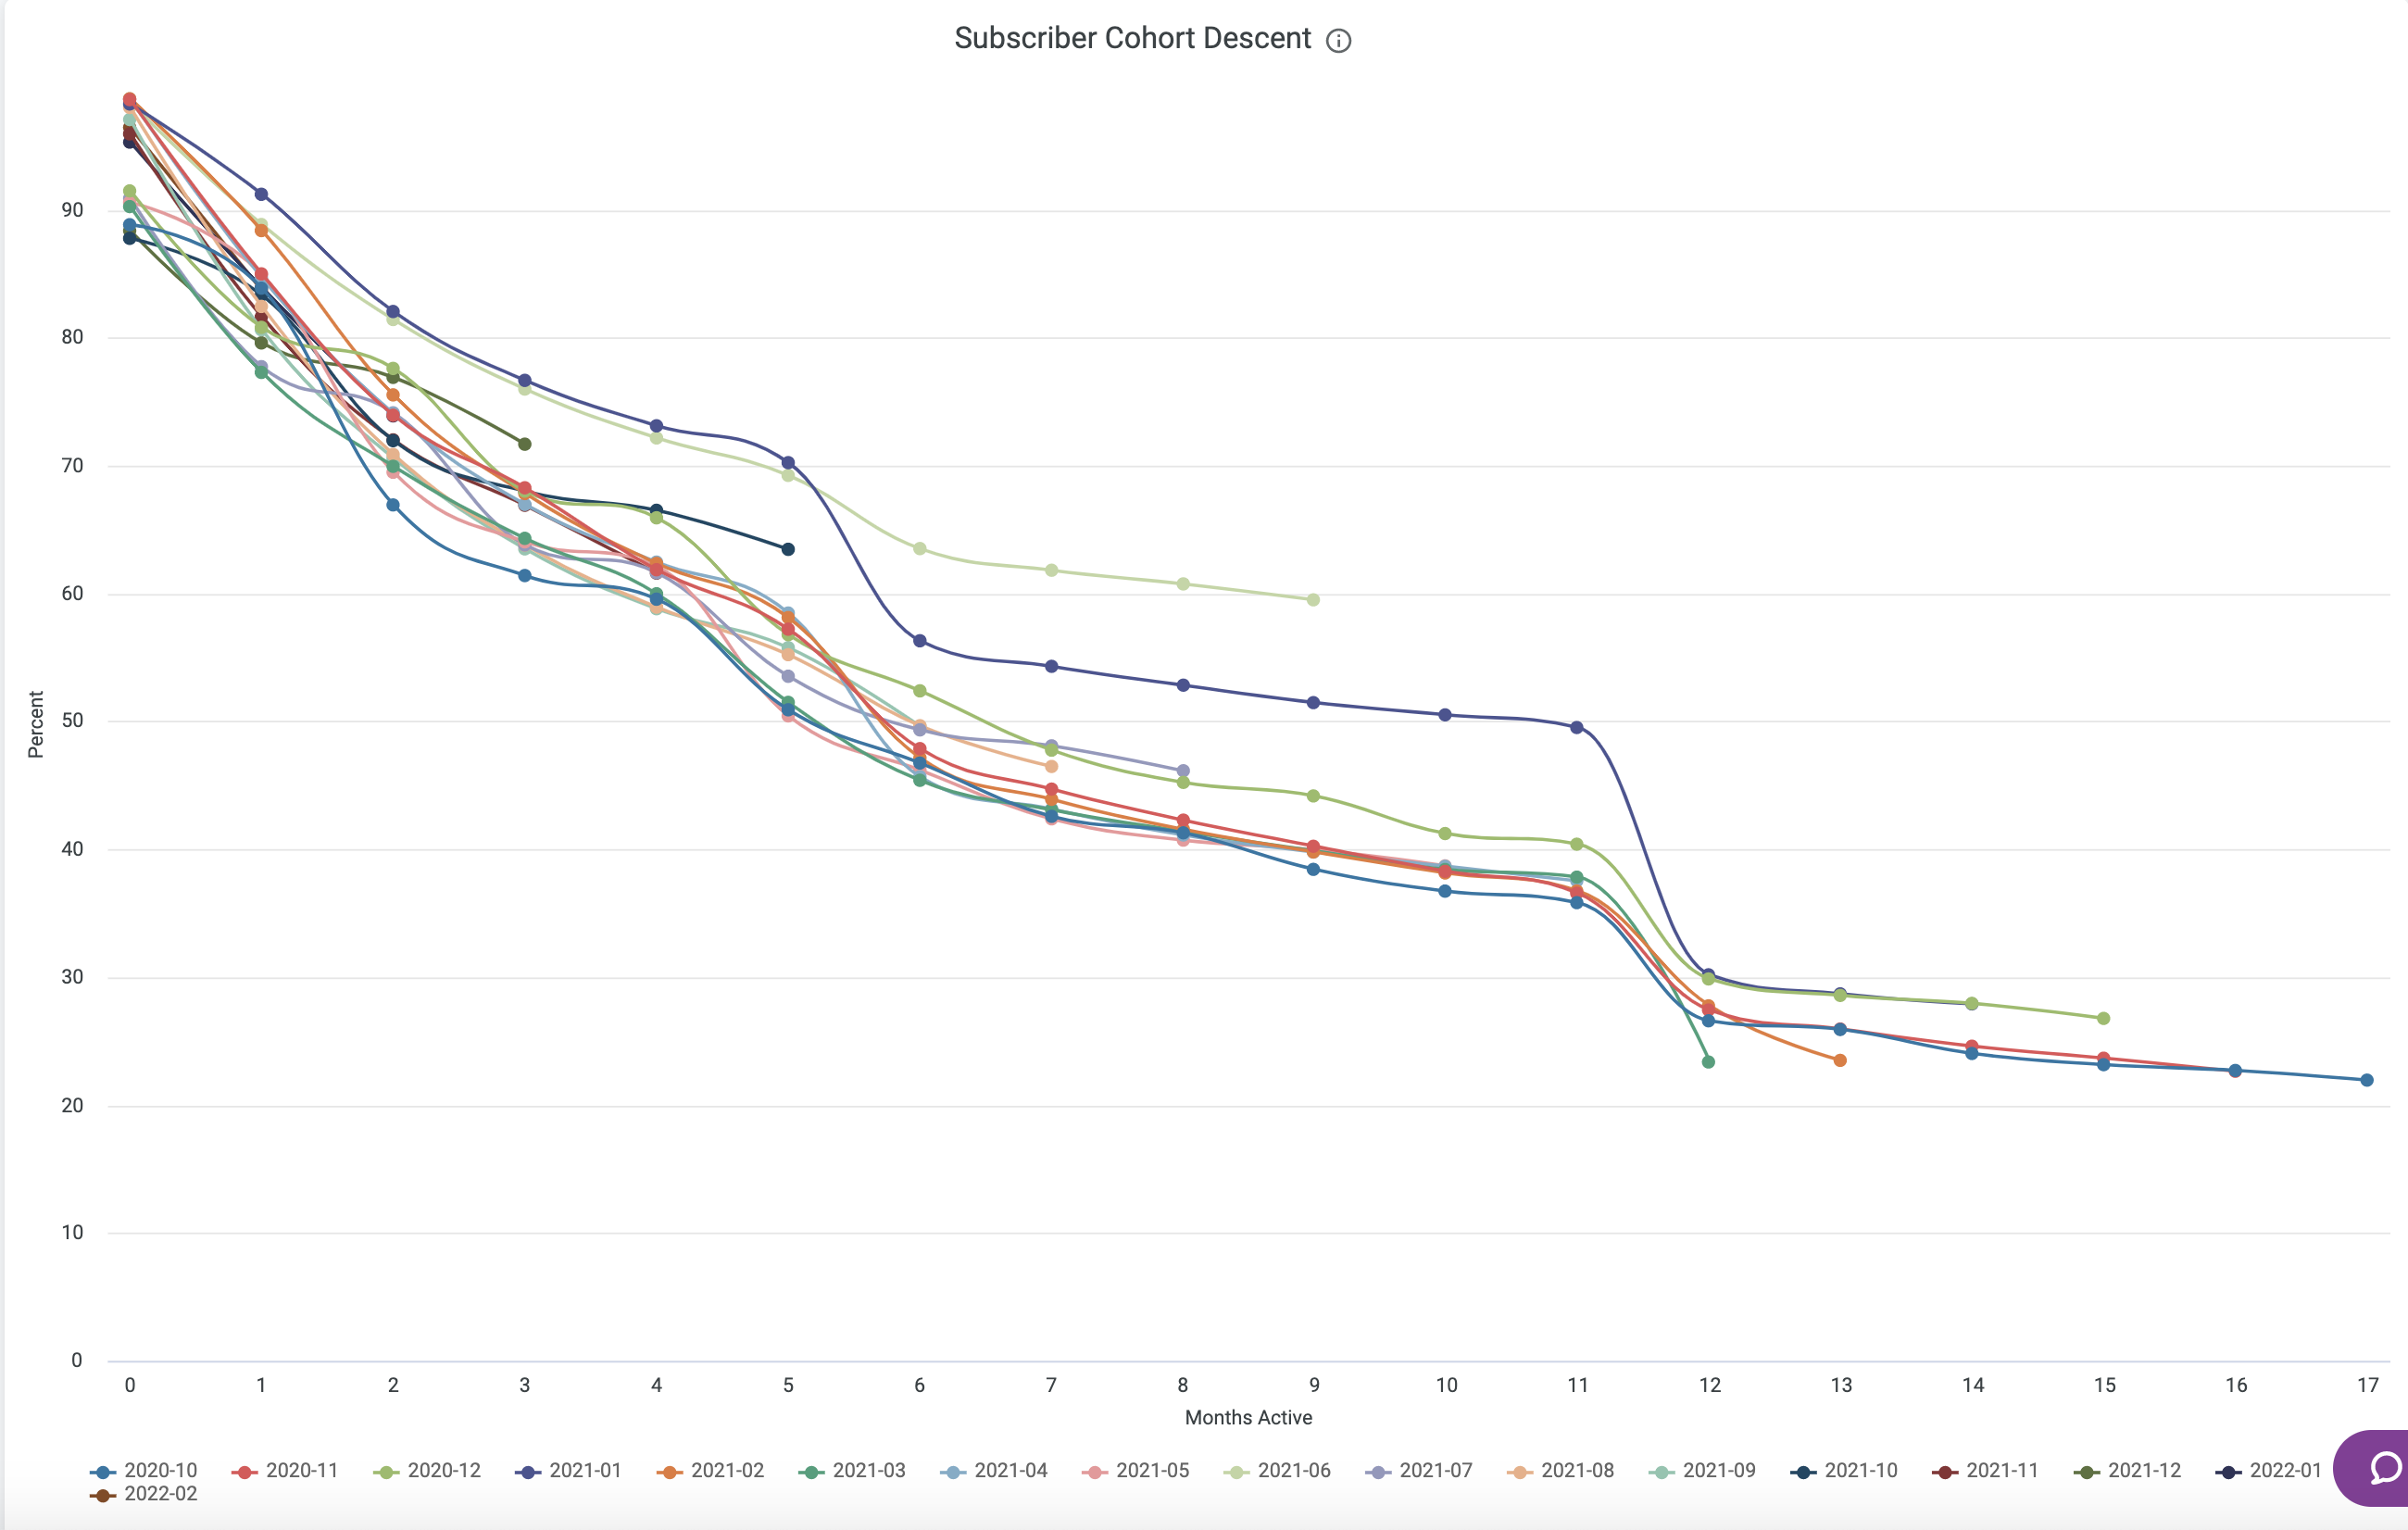
Subscriber Retention Cohort Descent
Cohort analysis detail is a cohort analysis of the retention count for paying subscribers who sign up in a given month. The example below shows the percentage of paying subscribers by month, and you can download up to 100 columns of data.
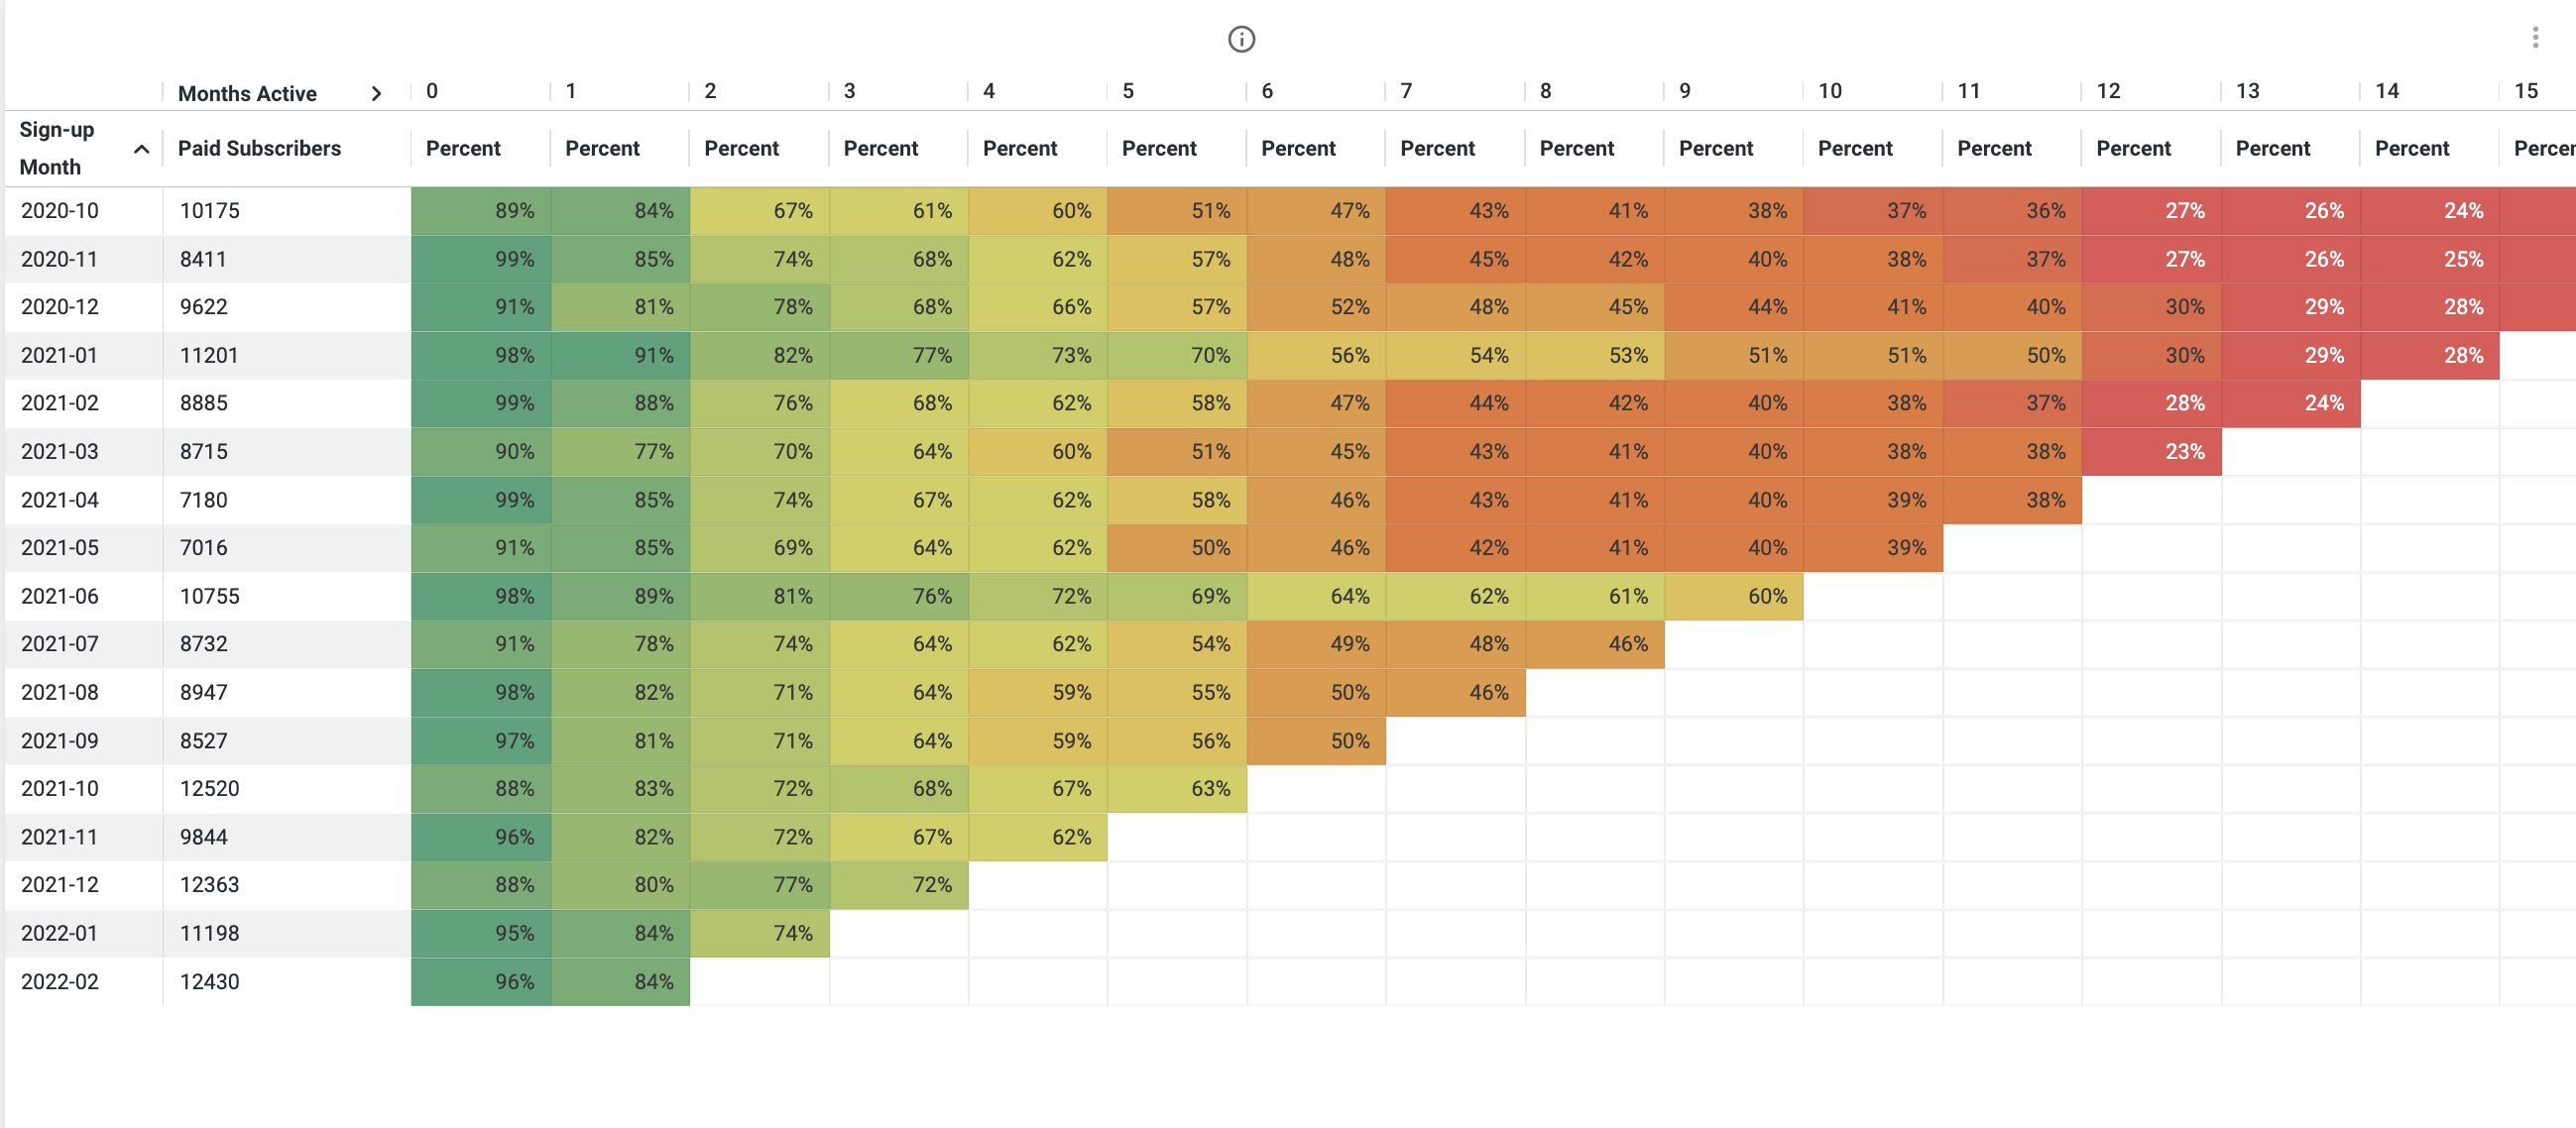
Subscriber Retention Cohort Analysis Detail
Drill experience
Drill into specific data points directly from the charts for a deeper look at the metrics behind each number.
The drill-down view includes several data columns, each representing a specific metric:
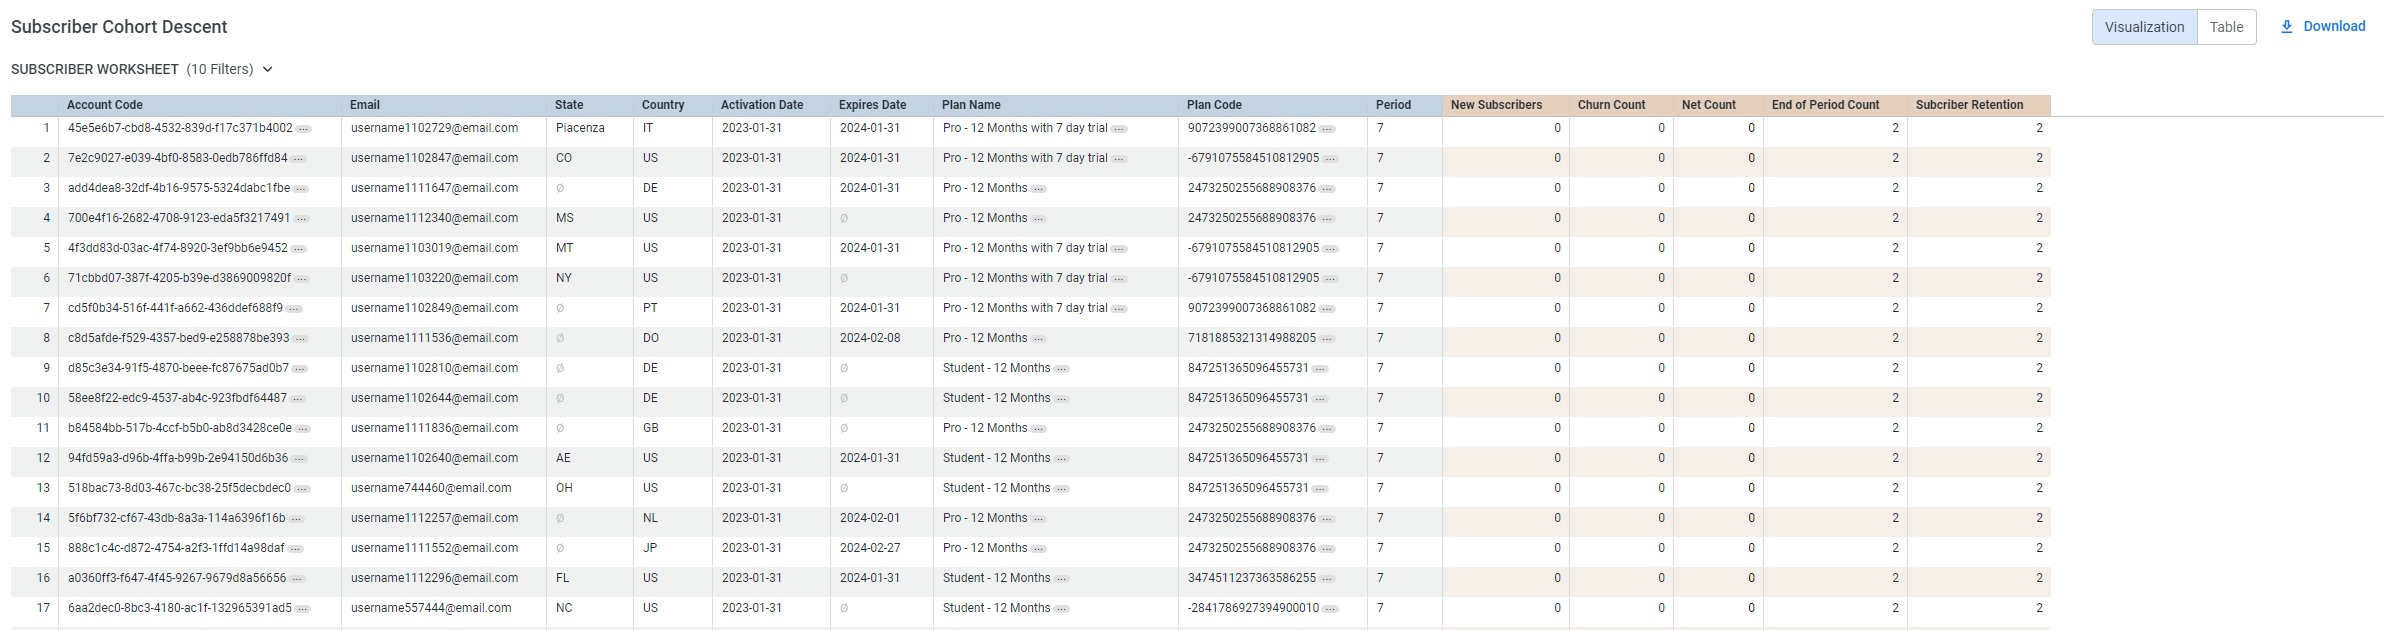
new_subscribers: Whether a subscriber is new within the specified period. A value of 1 indicates a new subscriber; otherwise, it's 0.churn_count: Whether a subscriber has churned. A value of 1 signifies a churned subscriber during the analyzed period.net_count: Whether a subscriber contributes to the total count displayed. A value of 1 means the subscriber is included in the net count.End of Period Count: Whether a subscriber is active at the end of the period. A value of 1 denotes an active subscriber at period end.subscriber_retention: Whether a subscriber was retained during the period. A value of 1 is assigned to retained subscribers.
Updated 2 months ago