
HomeProduct DocsAPI ReferenceChangelog
RecurlyAPI GuidesRecurly.jsWebhooksAPI ReferenceSupportBook demo
Product Docs

LTV by plan

Learn how to use Recurly's Plan Performance LTV dashboard to see average and subscription lifetime value by plan.

Plan Performance LTV shows you the lifetime value of your customers, broken down by plan. See both the average projected revenue per subscription and the total lifetime value across your top plans, so you can see which relationships are worth the most over time.
Available on all Recurly plans

Prerequisites

  • Users must have Analytics user role permission.

Definition

Plan Performance LTV gives you an in-depth look at the Lifetime Value (LTV) of your customers — the average projected revenue a customer is expected to contribute over their relationship with your business. Two sections, Subscription Lifetime Value and Average LTV, give you both a holistic and a granular view of that value.
NoteIt's important to understand the difference between a subscriber and a subscription. A single subscriber might hold multiple active subscriptions, but this dashboard counts each individual subscriber — not the number of subscriptions they hold. Data only includes plans that have had at least one subscriber.
TipFor more on navigating and using the filter tools, see our analytics overview documentation.

Key benefits

Strategic revenue projection Use the Average LTV formula to get a clearer picture of the potential revenue each plan can generate.
Complete customer valuation See both a detailed breakdown and an overall view of lifetime value by plan, highlighting which plans perform best over the long term.
Informed business decisions Identify your highest-performing plans and understand true customer value to refine your pricing, acquisition, and retention strategies.

Key details

Average LTV

Average LTV reflects the average projected revenue of subscriptions in the selected plans. It's calculated using the formula:

Average Subscription LTV = ARPS (1 + d) / (d + subscription churn rate)

Where:

  • ARPS is the Average Revenue Per Subscription — the MRR contributed by all subscriptions active at the end of the month, divided by the number of active subscriptions at the end of the month.
  • Subscription churn rate is the number of churned subscriptions divided by the number of subscriptions active at any point during that month.
  • d is the discount rate — a consistent value used in revenue projection that factors in market, financial, and other risks, along with the time value of money. Recurly sets this at 1% by default, but you can adjust it using the Monthly Discount Rate dropdown.

Subscription lifetime value

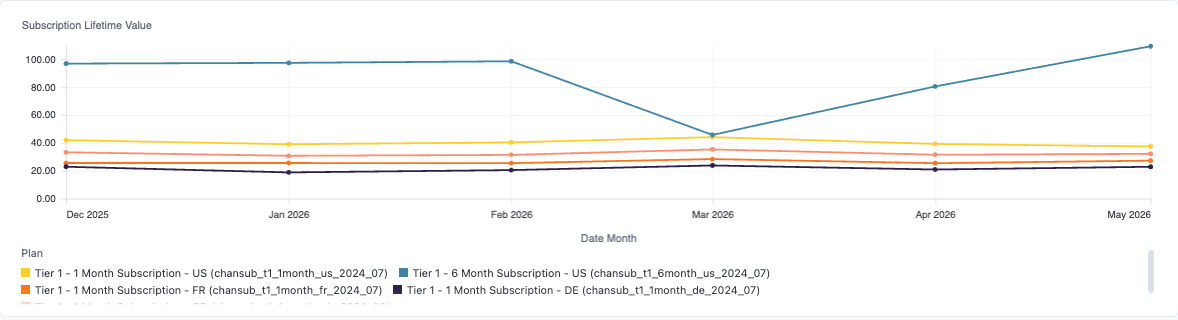
This section visualizes the lifetime values of your subscriptions for selected plans, using a detail chart and a total line chart.

Lifetime value

The line chart shows the calculated lifetime value of subscriptions for your selected plans, giving you a picture of the fiscal value of long-term customer relationships.
Subscription lifetime values

This detailed chart breaks down lifetime value for the top 5 plans by your selected timeframe, helping you understand the long-term financial performance of each one.

How to use the Average LTV feature

1

Access the LTV view

On your Plan Performance dashboard, navigate to the LTV view.

2

Explore the Subscription Lifetime Value section

Review the Lifetime Value and Subscription Lifetime Values charts to understand the LTV of different plans.

3

Use the Average LTV formula

Calculate Average Subscription LTV using ARPS, churn rate, and discount rate for a deeper read on your LTV.

4

Identify high-performing plans

Use these charts to find which plans have the highest LTV, and consider focusing marketing and retention efforts there.

5

Apply these insights to strategy

Use what you find to inform decisions about pricing, customer acquisition, and retention.


Did this page help you?