Checkout analytics dashboard
Dive deep into Recurly Checkout data to analyze performance at driving cart conversion to acquire subscribers and sell products.
Prerequisites
- Users must have the Analytics user role permission
- At least one Checkout configuration must be created before data appears in the dashboard
Limitations
- When no Checkout configurations exist, the dashboard displays a prompt to create one rather than any chart data. The dashboard becomes visible once at least one configuration has been created and checkout sessions have occurred
Definition
Key benefits
Key details
Filters
Two filters at the top left of the dashboard control the data shown across all charts:
- Date range — Select a specific start and end date for the data displayed.
- Timeframe — Adjust the granularity of the view for a more detailed or broader overview.
Checkout visits
The Checkout visits chart shows how many customers are visiting your checkout pages during the selected period, with a month-over-month comparison.
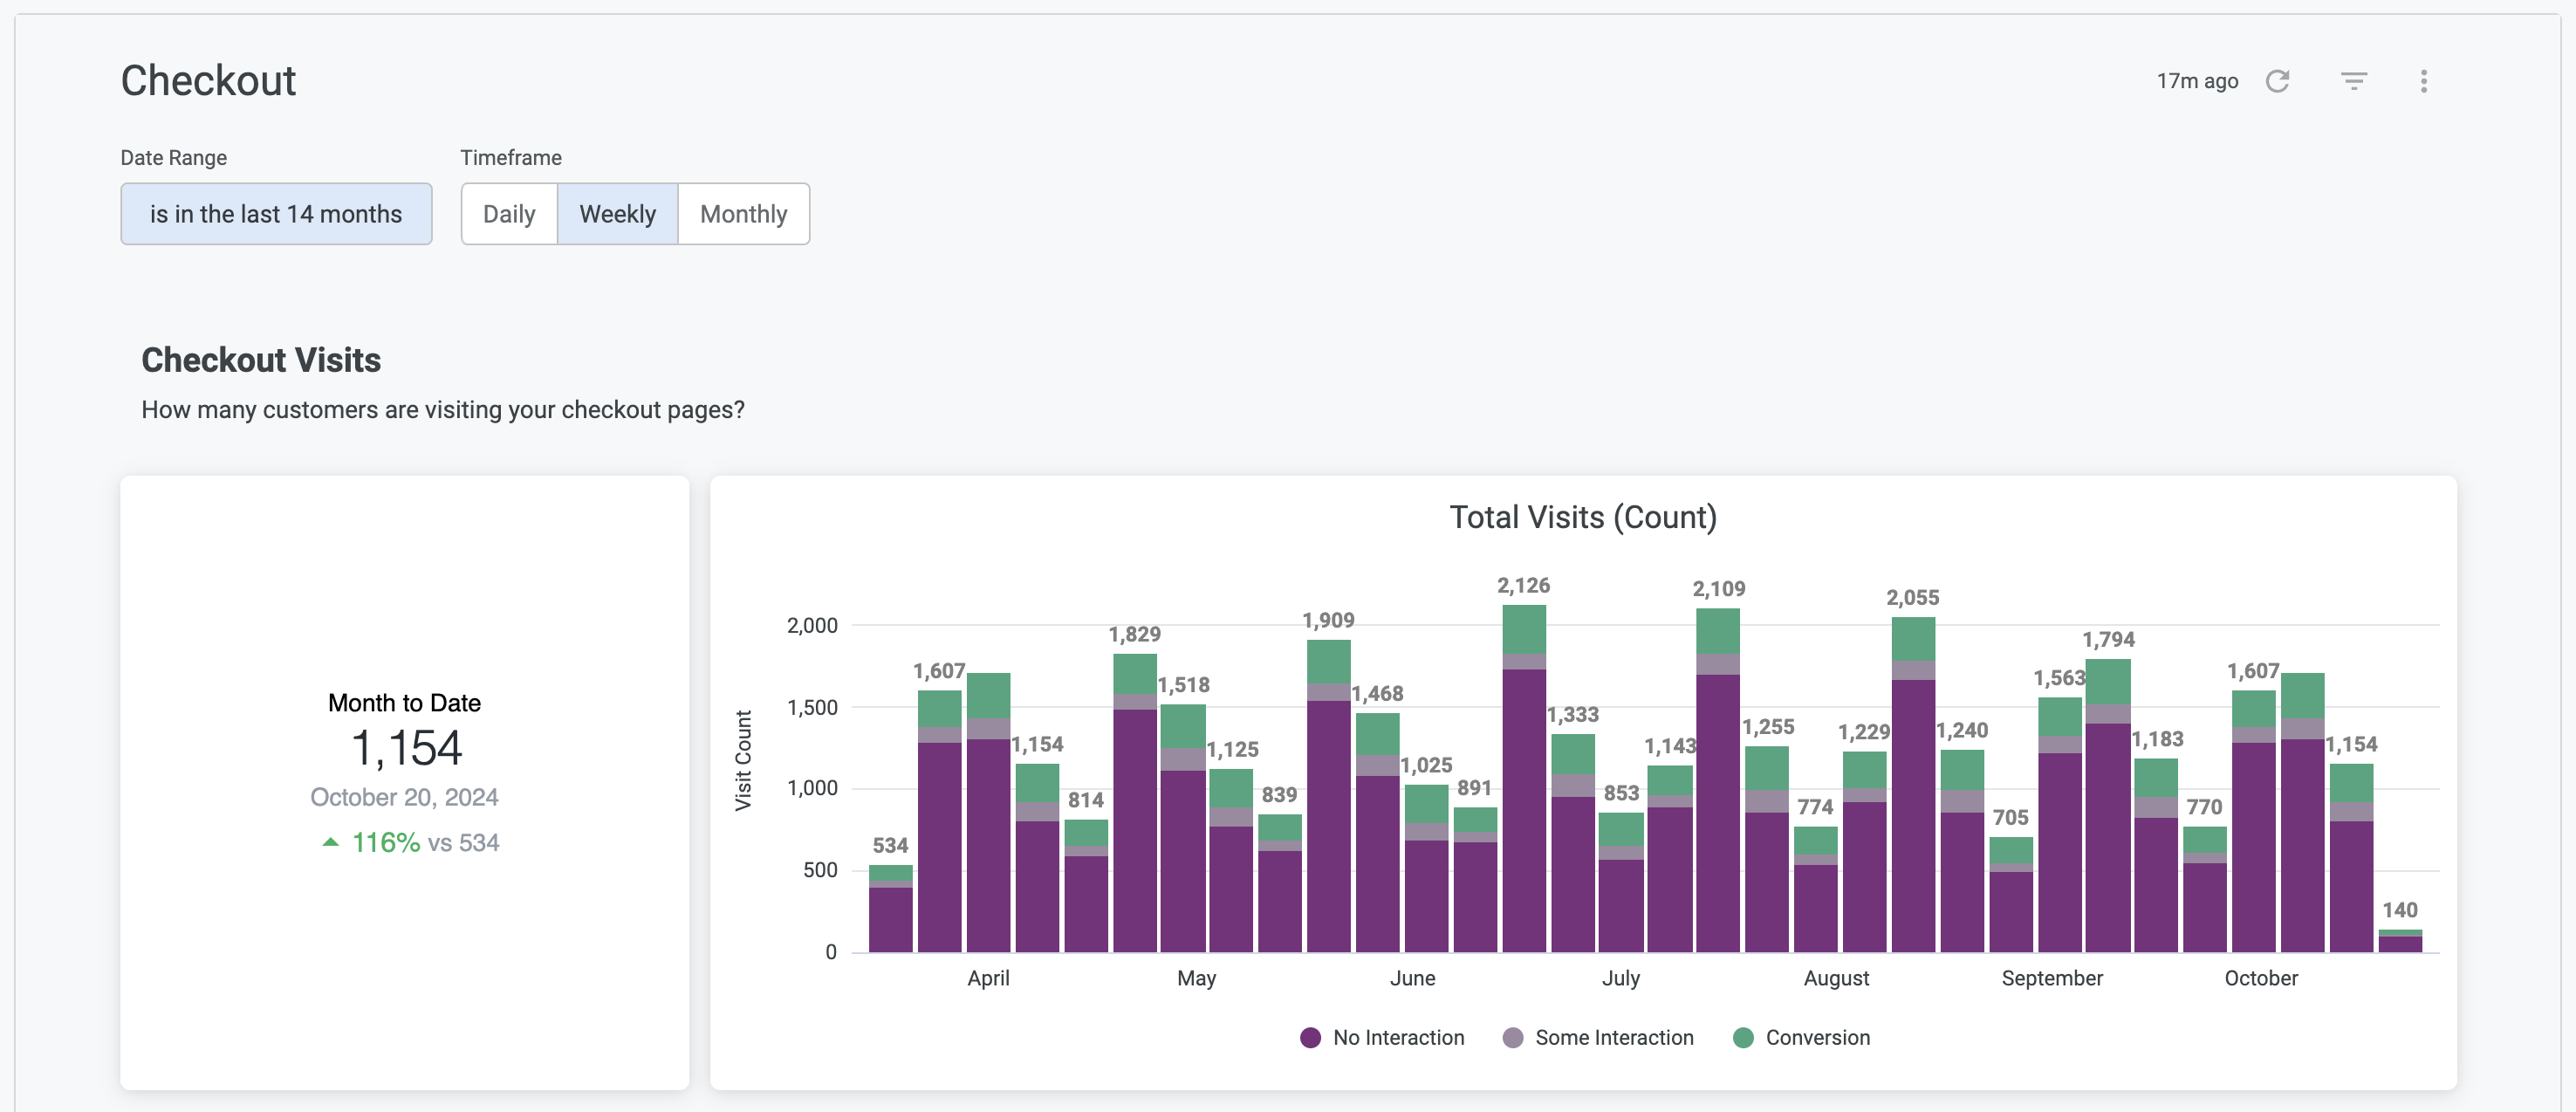
The bar chart breaks visits into three groups: customers who landed on the page without interacting, customers who engaged with at least one element (such as entering payment information or modifying the cart), and customers who completed a purchase.
Checkout conversion
The Checkout conversion chart answers the core question: of all the customers visiting your checkout pages, how many are completing a purchase?
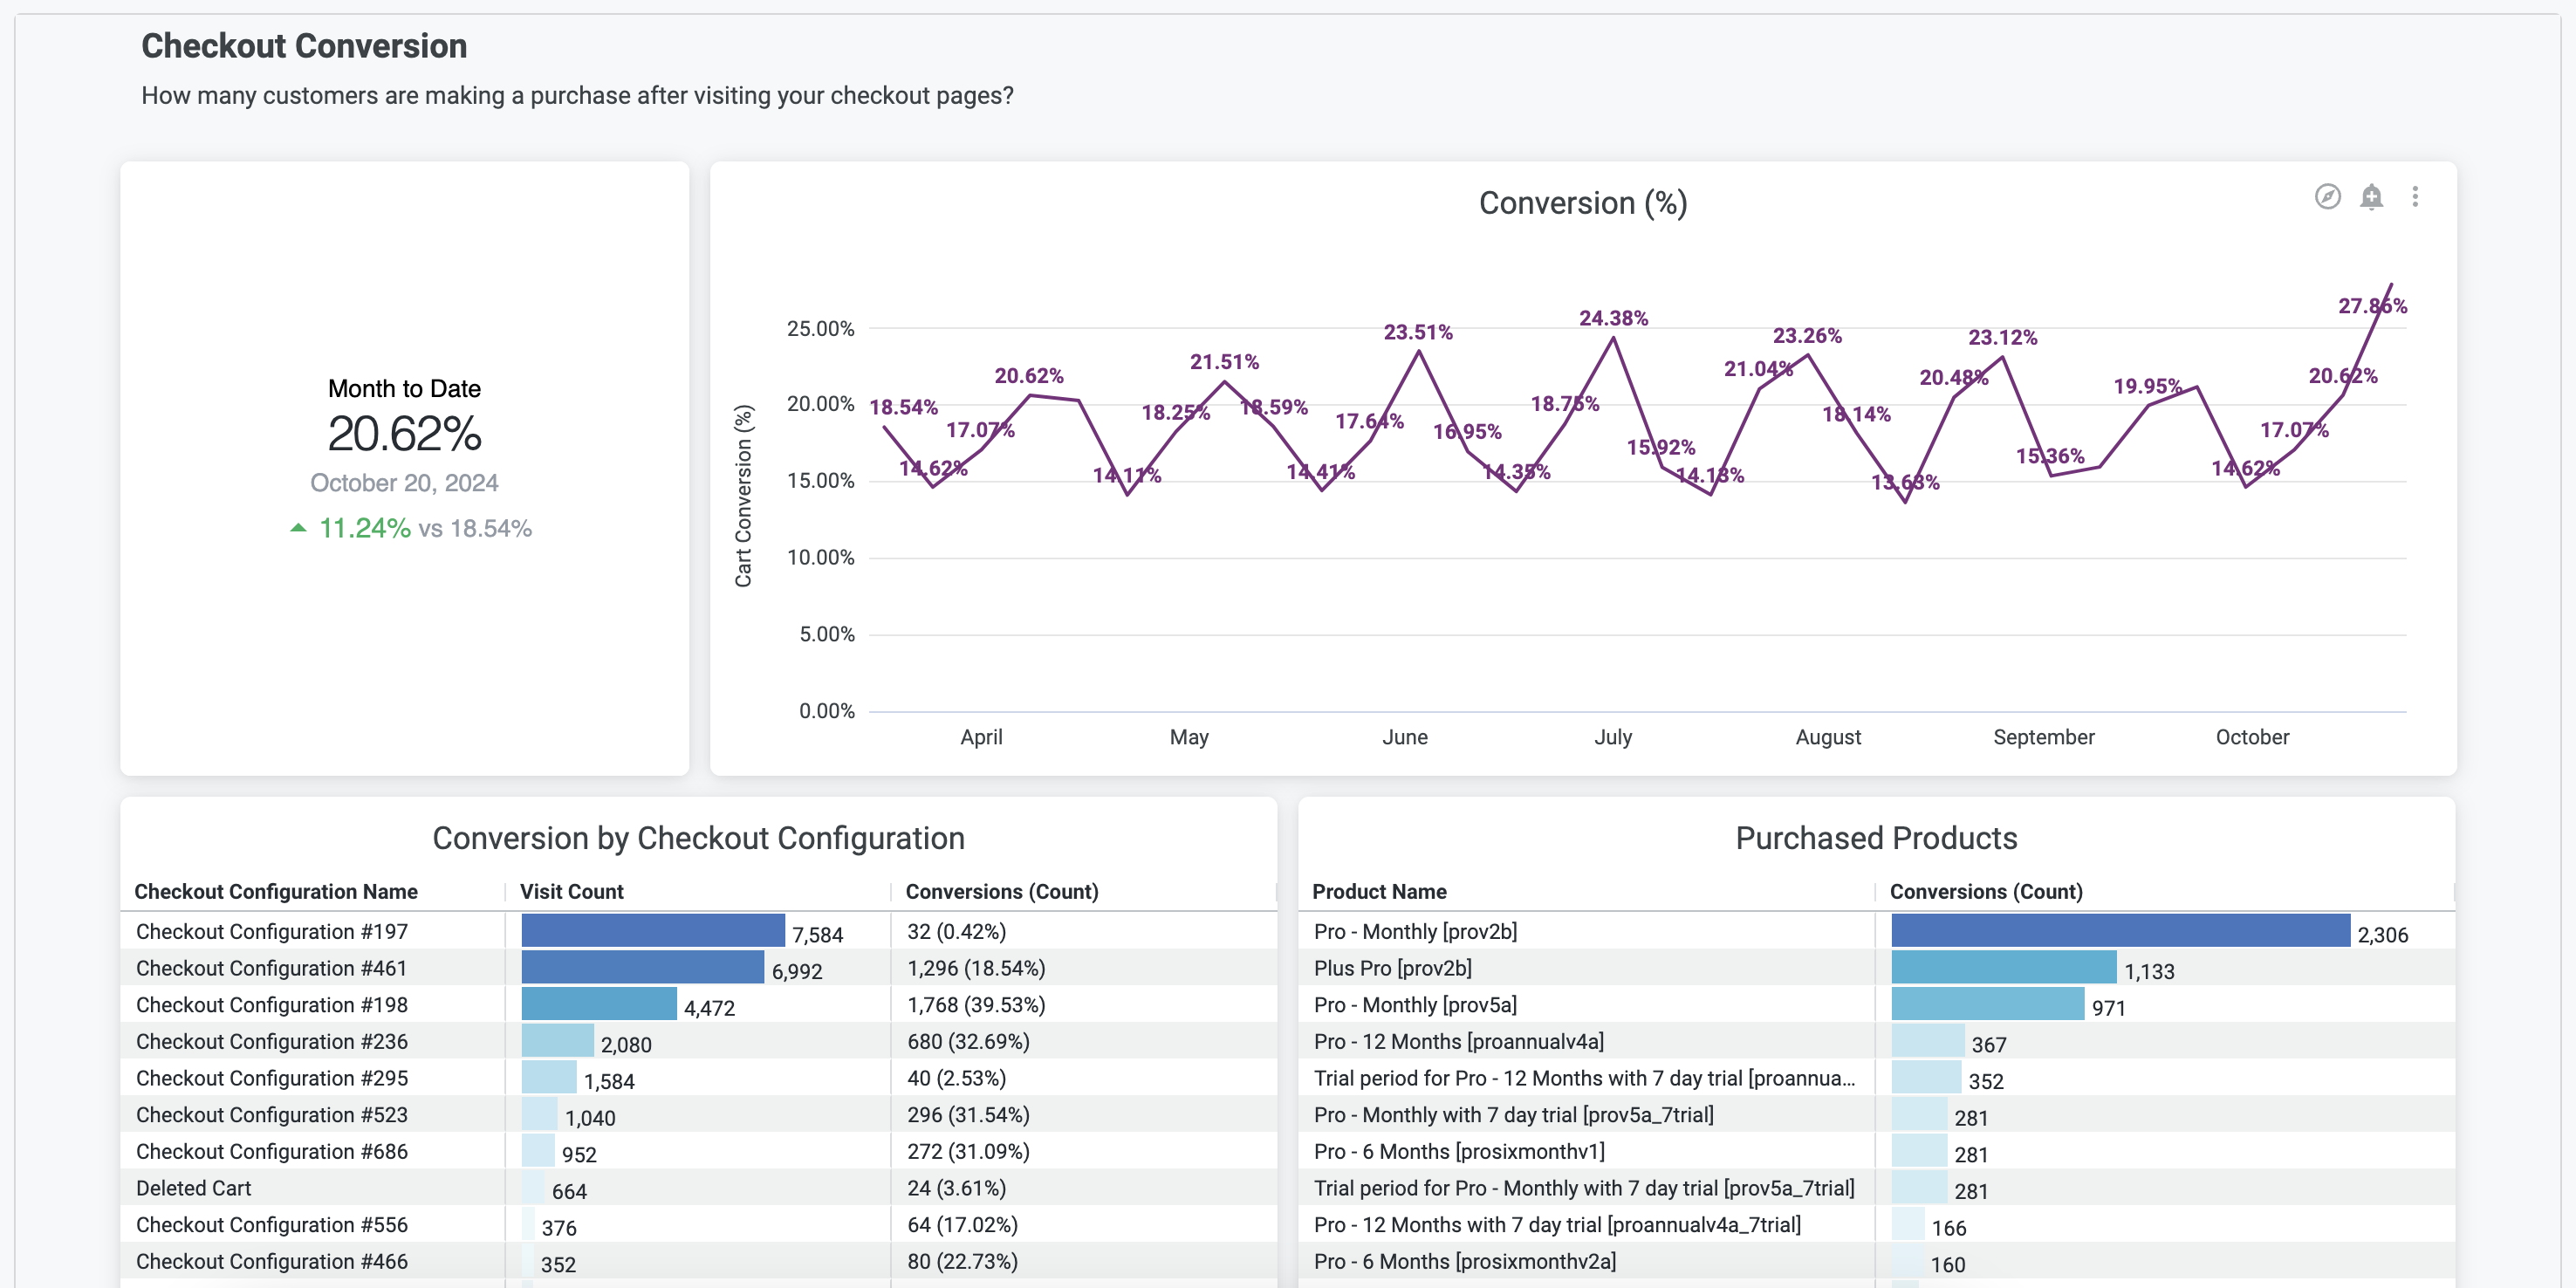
View overall conversion across all configurations, or drill down into individual configurations to compare performance. The chart also shows which products customers purchased per configuration — useful for understanding which offerings resonate most with your audience. Use this data to prioritize high-performing configurations and deprioritize underperforming ones.
Checkout average order size
The average order size chart shows how much customers are spending per order, trended over time with a prior-month comparison.
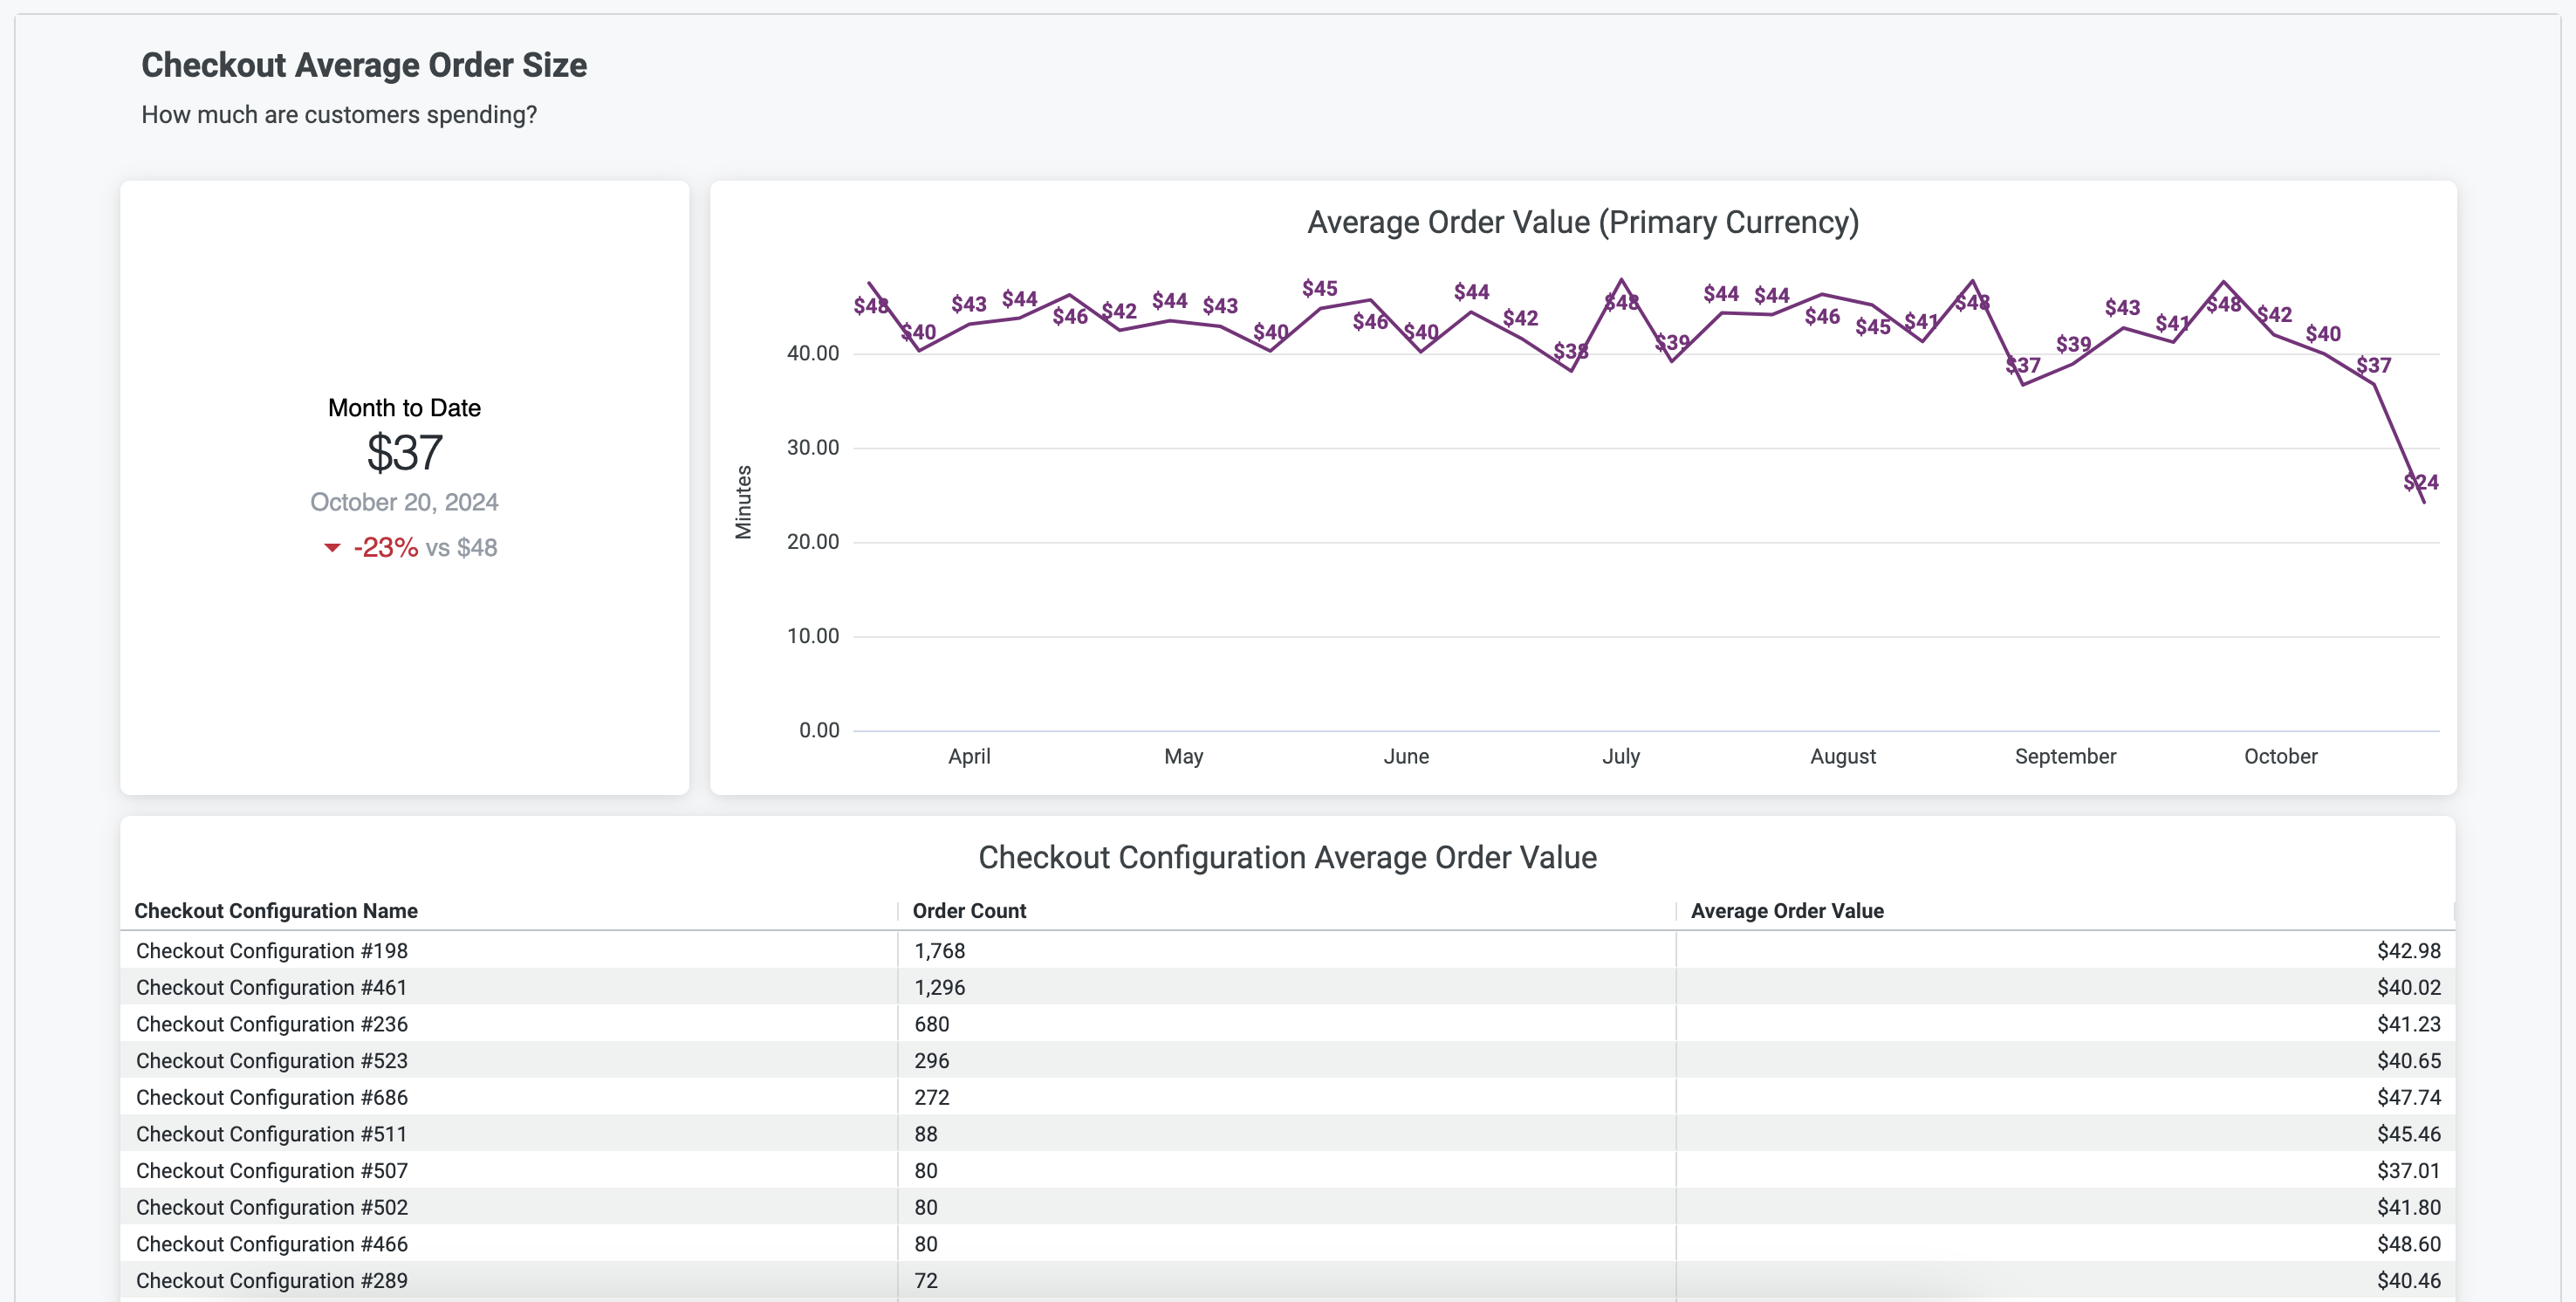
Monitoring this metric alongside conversion rates helps you identify which configurations are generating the most revenue — not just the most purchases.
Time to checkout
The time to checkout chart shows how long customers are spending in the checkout flow for each configuration.
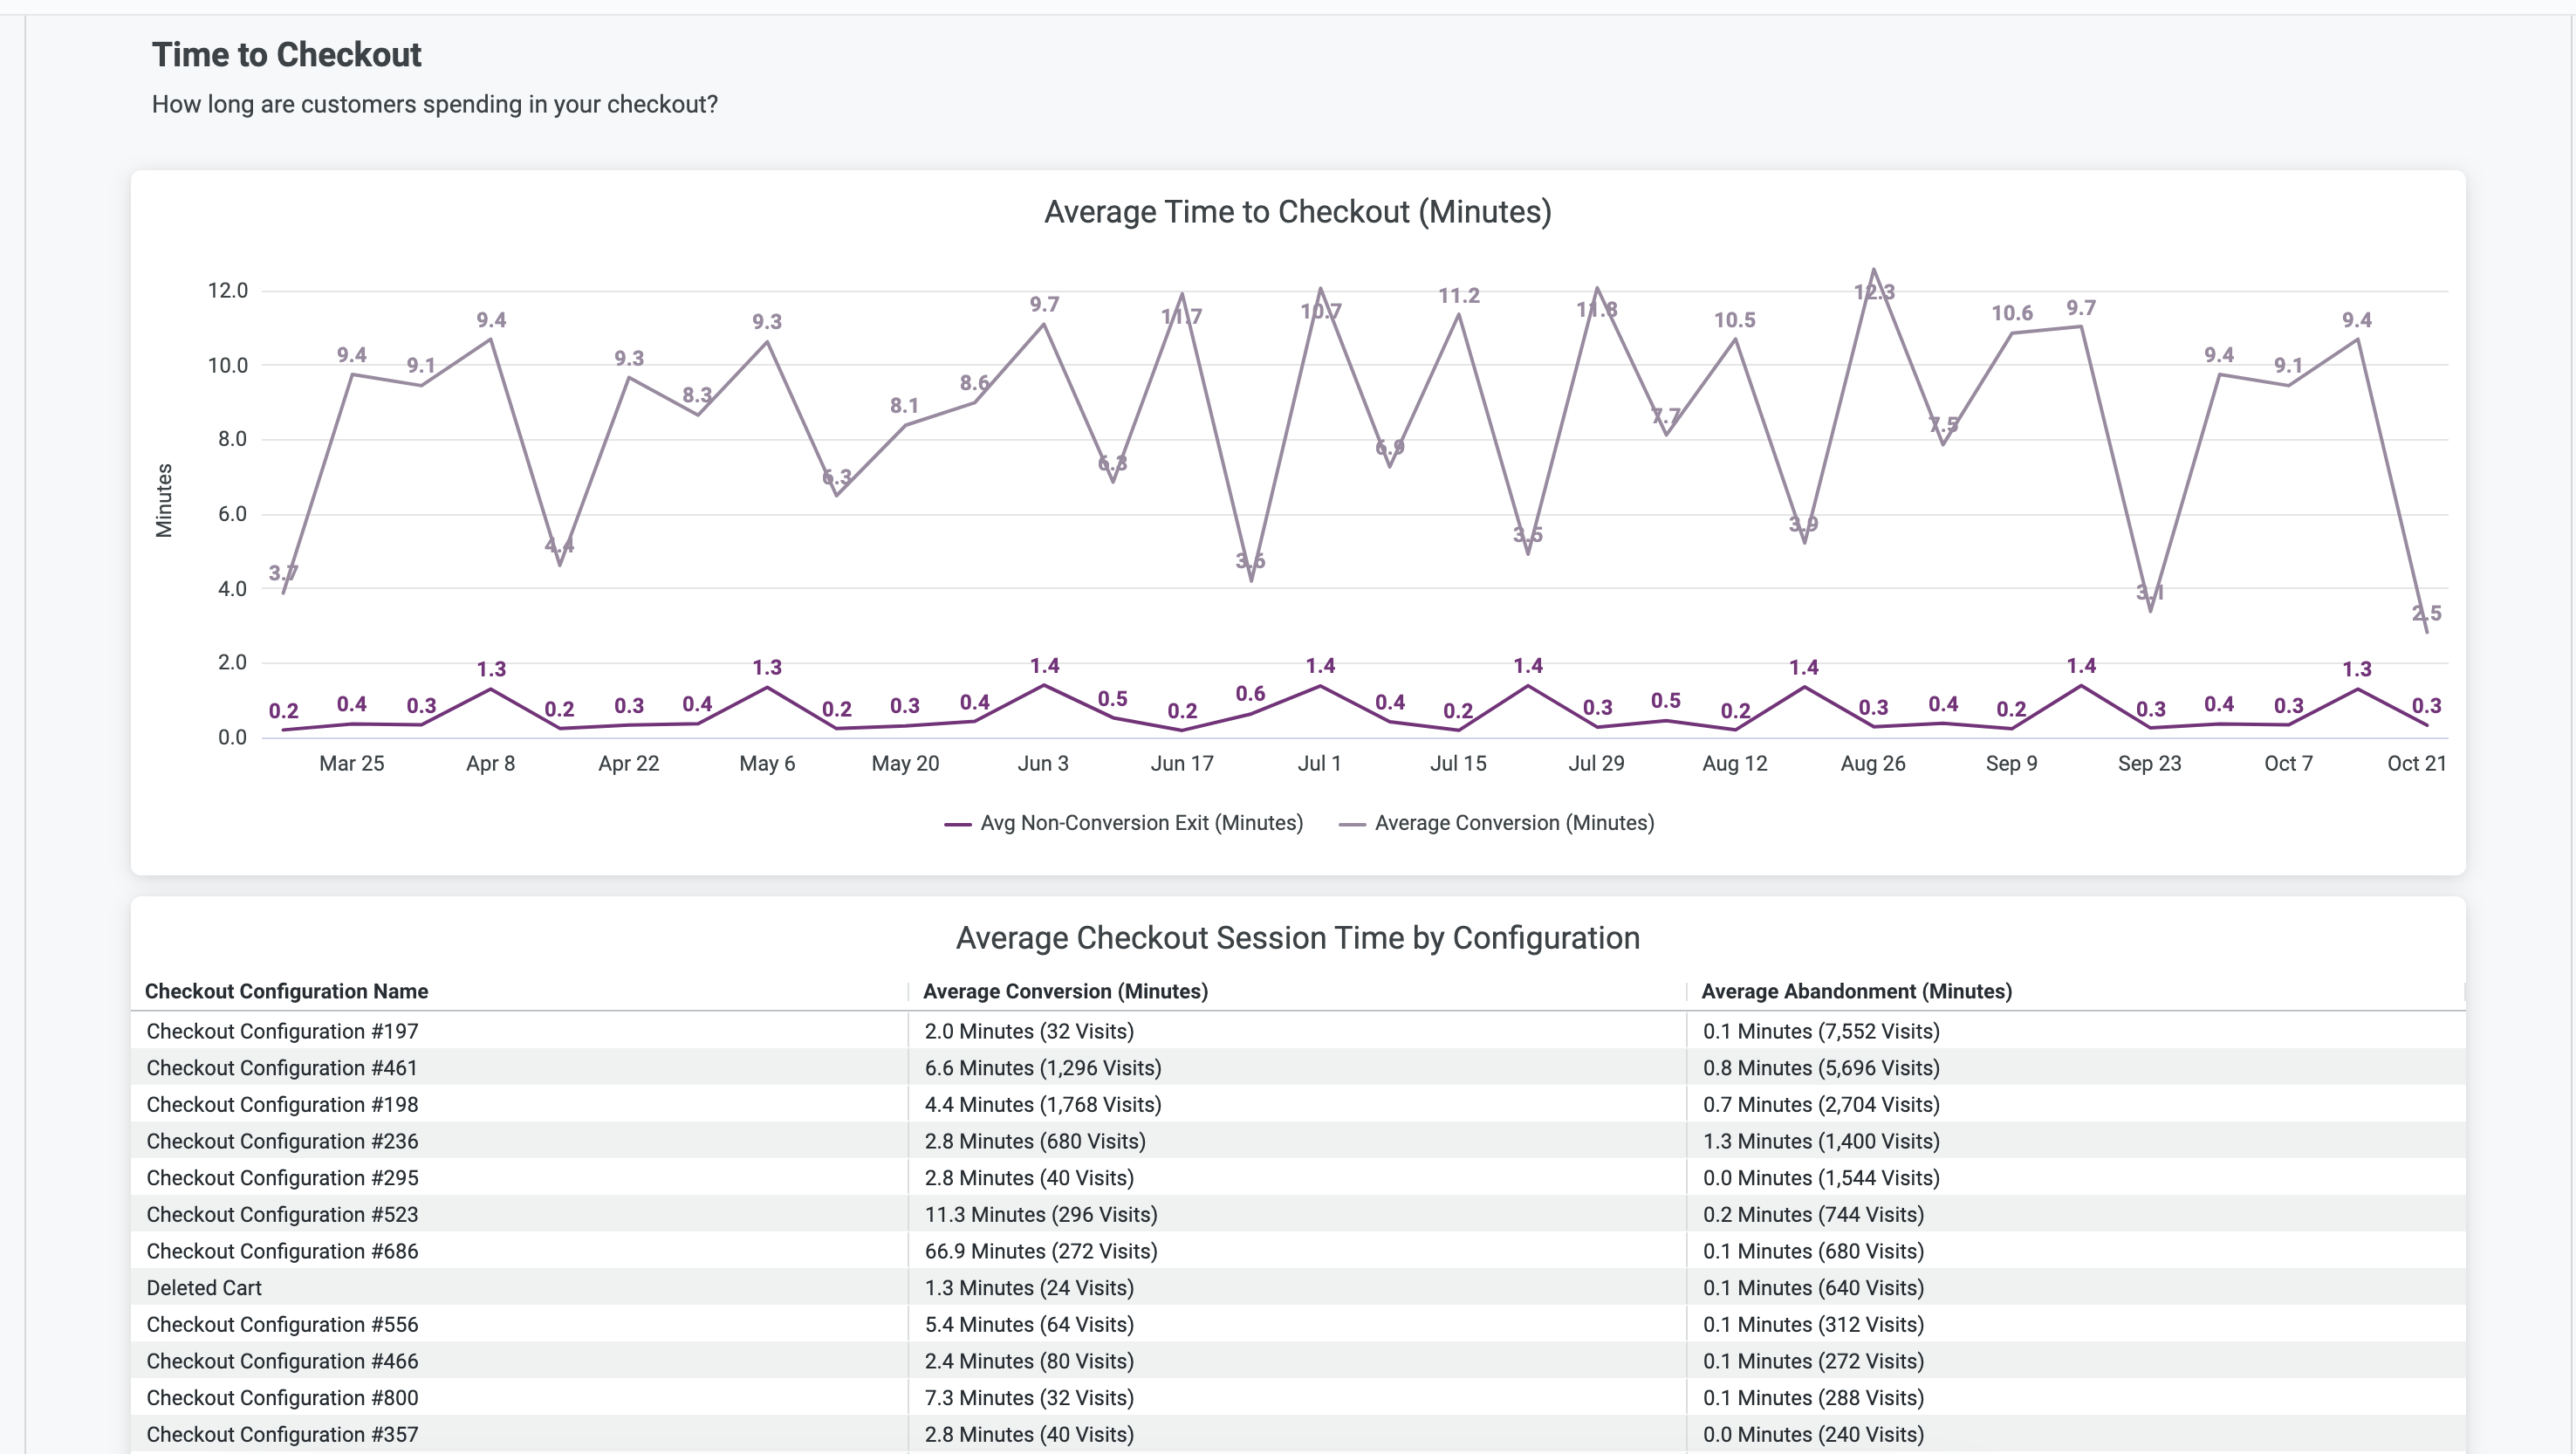
Configurations with shorter completion times may indicate a simpler, more optimized flow. Compare time to checkout against conversion rates and average order value to understand the trade-offs each configuration is making.
Checkout errors
The Checkout errors chart shows what errors customers are encountering during the checkout process.
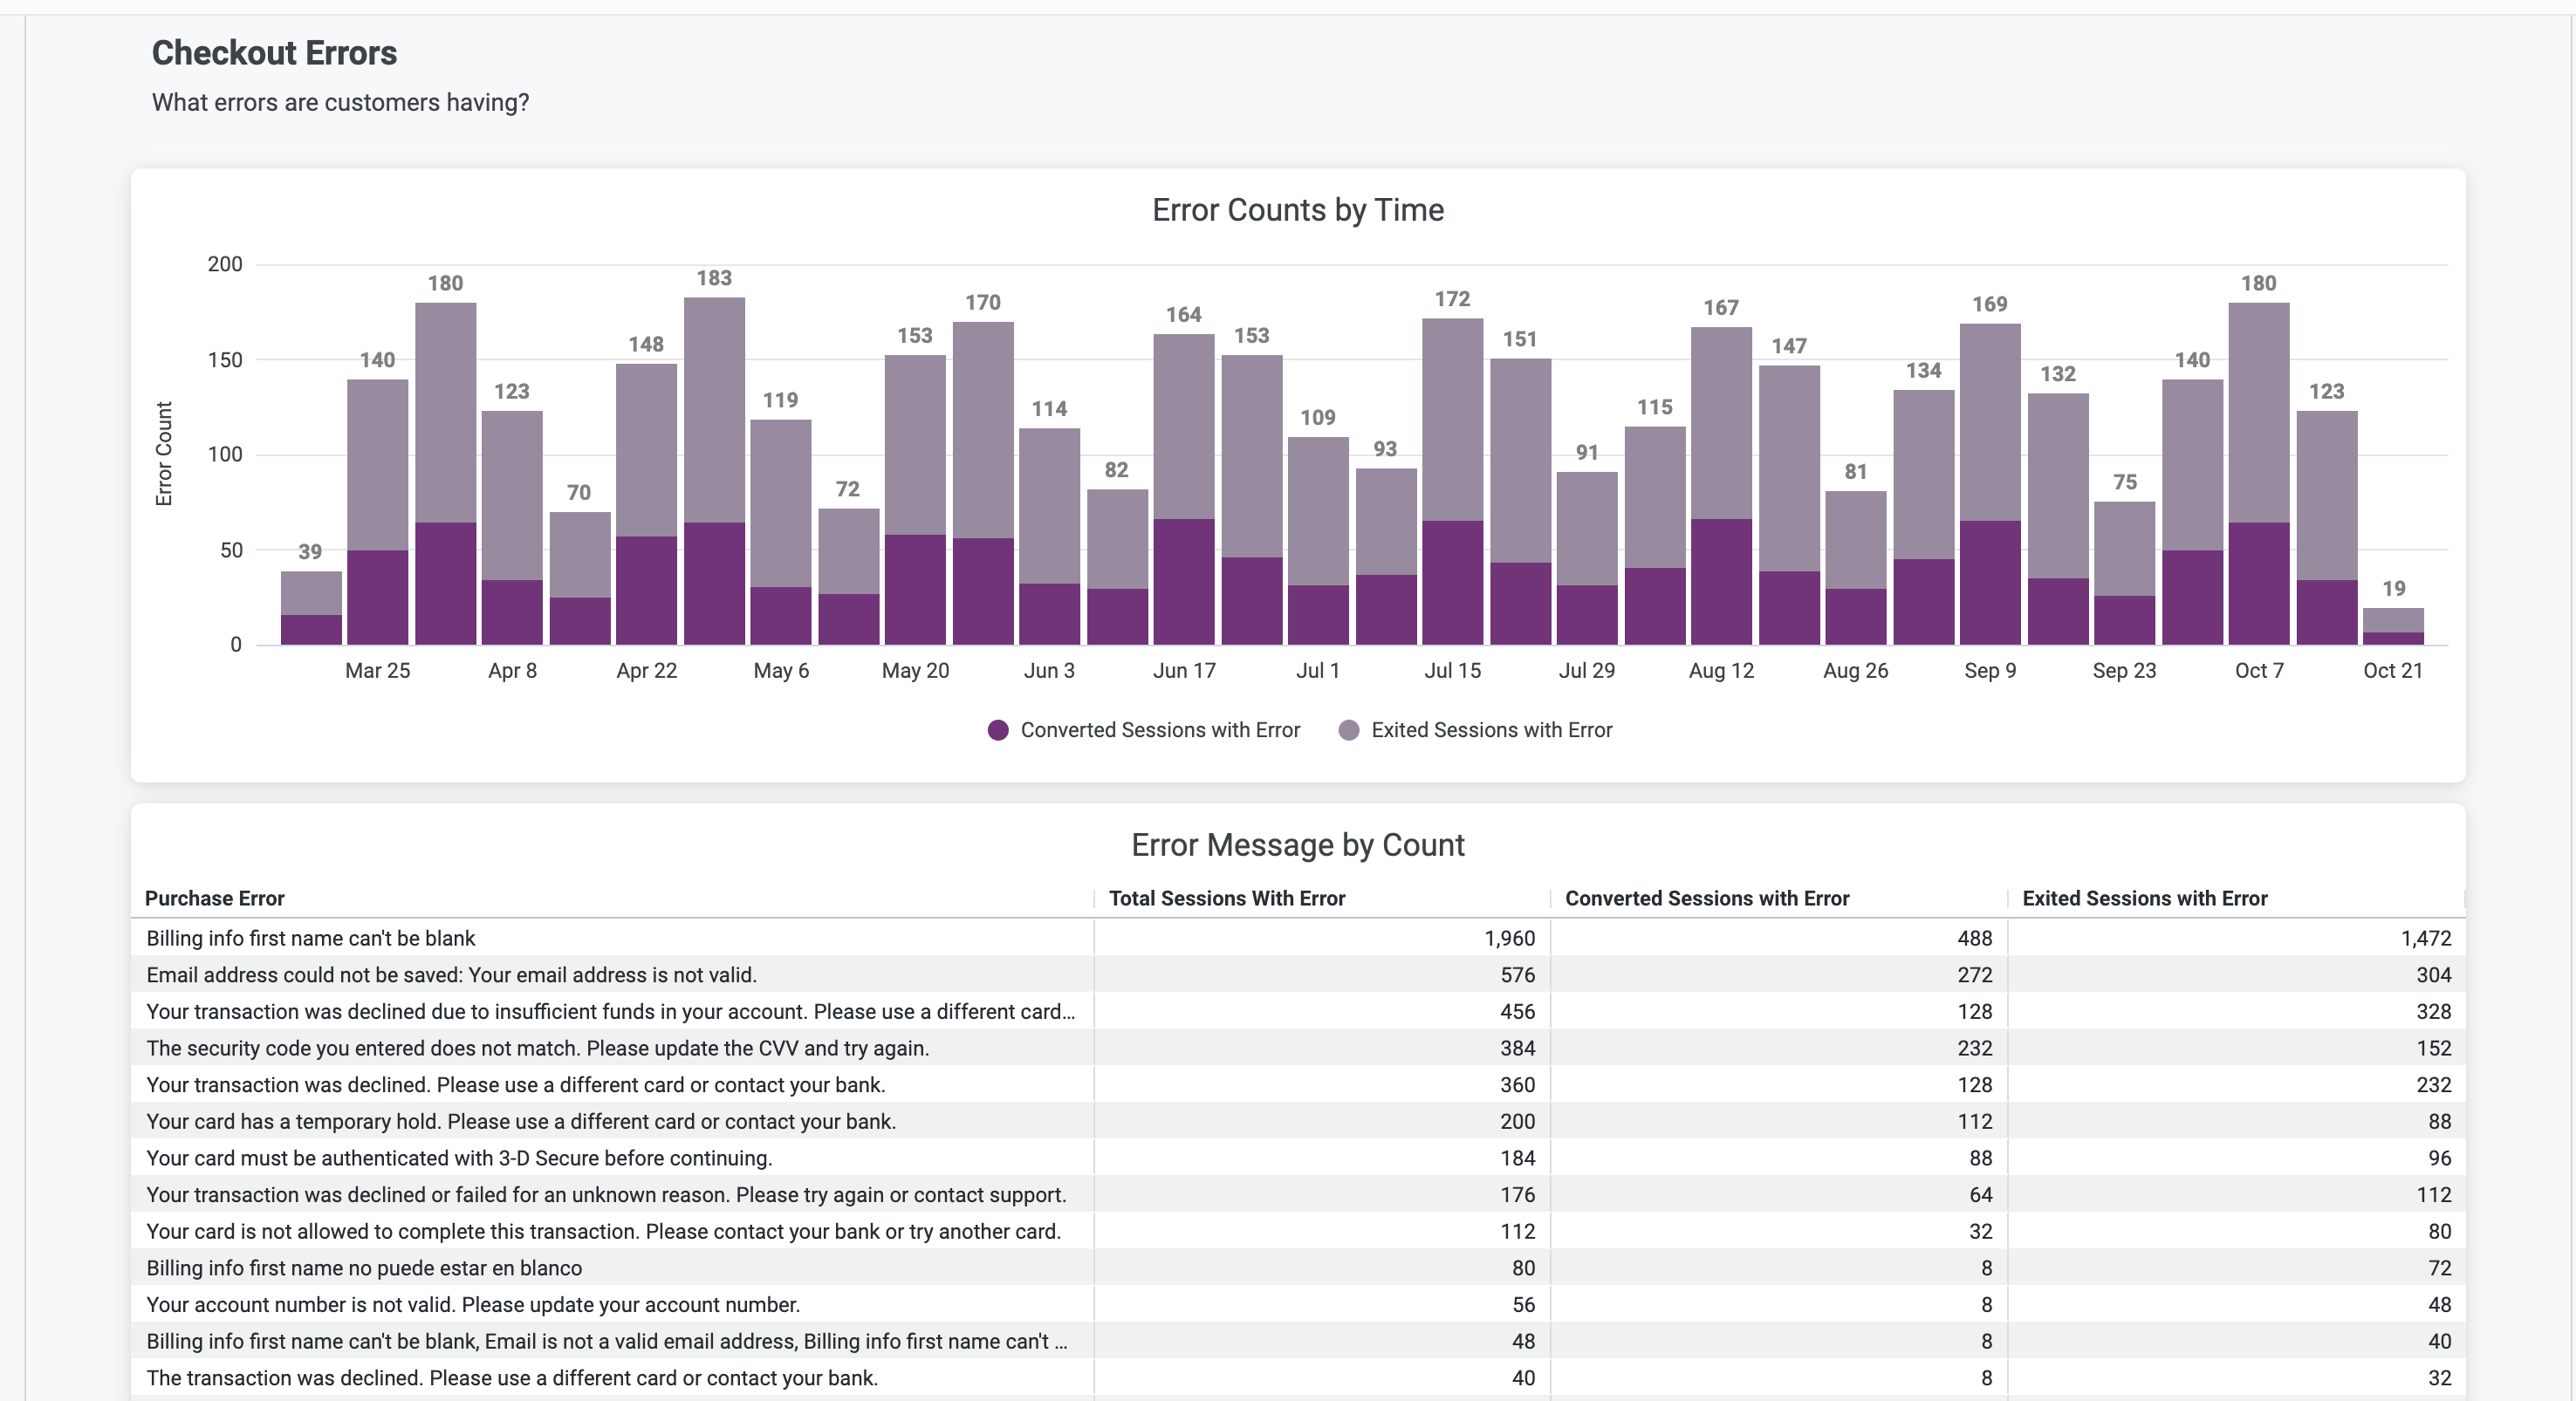
Review this chart regularly to surface recurring issues. Spikes in errors may point to gateway configuration problems that can be adjusted to reduce failed transactions and checkout abandonment.
Updated 27 days ago