
Renewal declines trendalyzer
Analyze your renewal decline trends of various metrics with dynamic pivoting.
The renewal declines trendalyzer dashboard helps you dig into failed renewal invoices and understand where your payment strategy is falling short. Pivot the data across payment type, brand, gateway, and failure type, then trend it daily, weekly, or monthly over any date range you choose.
Available on all Recurly plans
Prerequisites
- Users must have Analytics user role permission.
Definition
The renewal declines trendalyzer dashboard is a pivotable breakout dashboard for failed renewal invoice data. Select a primary dimension and up to two breakout dimensions, choose a metric — Decline Rate, Total Transactions, or Failed Transactions — and the dashboard rebuilds the chart and table to match.
Key benefits
Informed decision-making
Make data-driven decisions to set realistic goals and strengthen your subscription growth and customer retention strategies.
Forecasting and planning
Improve forecasting and resource allocation to set reachable growth targets.
Customizable data views
Pivot data to optimize how it's presented, select specific metrics, and analyze trends across daily, weekly, or monthly ranges.
Key details
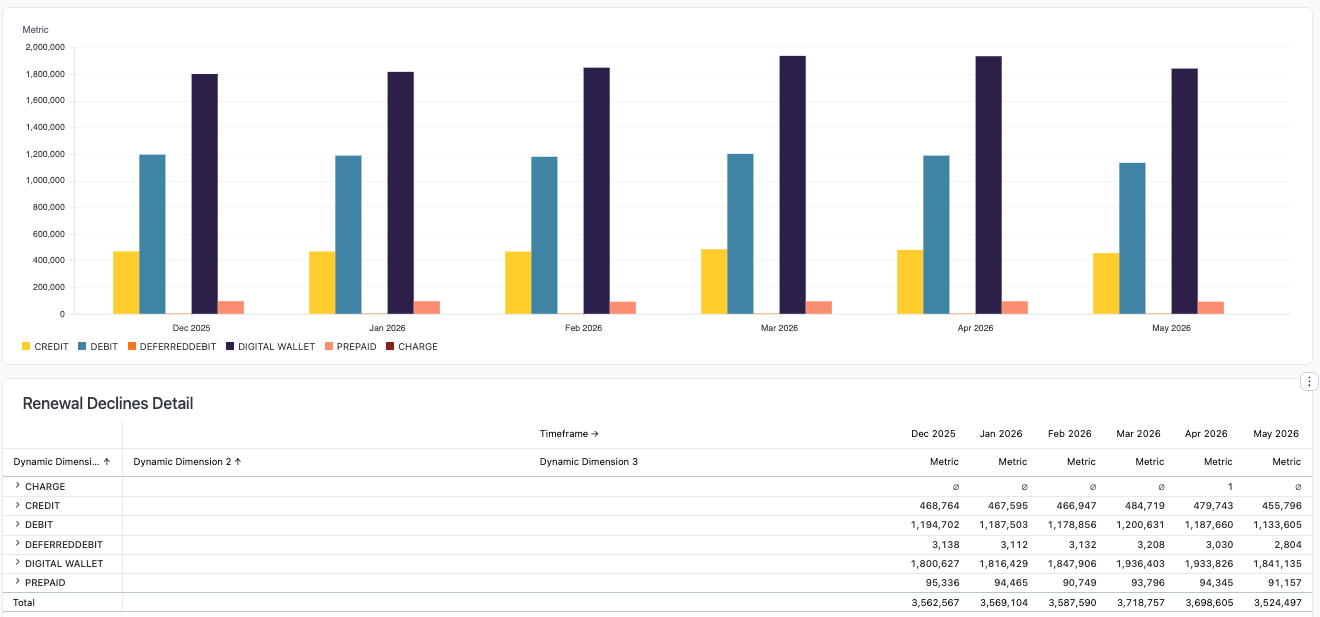
This breakout dashboard lets you adjust the pivot table to view fields in different orders and switch between metrics like Decline Rate, Failed Transactions, and Total Transactions. The top chart shows your primary dimension over time, while the table breaks that dimension down by your selected breakout dimensions.
General filters (top left corner)
- Timeframe: Analyze different monthly timeframes.
- Invoice creation date: Choose a specific date range, up to the last 18 months, using the start and end date dropdowns.
- Primary dimension: Focus on a specific metric by selecting from Payment Type, Brand, Gateway, or Failure Type.
- Dimension breakout 1: Select an additional dimension from the list, or view all dimensions.
- Dimension breakout 2: Choose another dimension from the list, or view all dimensions.
- Metric: Select the key metric to analyze — Decline Rate (%), Total Transactions, or Failed Transactions.
- Gateway type: Specify the gateway you'd like to view in the data.
- Failure type: Filter by failure reason, choosing the top 5, top 10, or all reasons.
Updated 2 months ago
Did this page help you?