
Payment processing
Dig into your payment stack's performance — success rates, trends, and breakdowns by gateway, payment method, and card BIN.
Prerequisites
- You must have the Analytics user role permission.
- To see splits in pie chart cards, your site must be processing more than one payment method, such as cards and ACH, or cards and Apple Pay.
Definition
Key benefits
Key details
General filters (top left corner)
- Date range — Adjust the time interval for your data to track and analyze long-term trends. The default view is 30 days.
- Country — See data specific to your country, offering relevant insights and comparisons.
- Gateway — Segment and analyze data by available payment processors — look at all gateways together or examine one at a time to understand where issues are happening.
- Payment method — See the breakdown of failed payments by the method your customers use, and select specific payment options to analyze.
- Initiated by — Select between CIT (customer-initiated) or MIT (merchant-initiated) transactions.
- Currency — Narrow your view to a specific currency or currencies.
Payment success rate
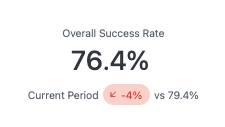
This card displays your overall payment success rate as a single, at-a-glance percentage — encompassing both customer- and merchant-initiated transactions for a fully holistic view of payment health — paired with a comparison to the previous time period, so you can immediately see whether performance is moving in the right direction.
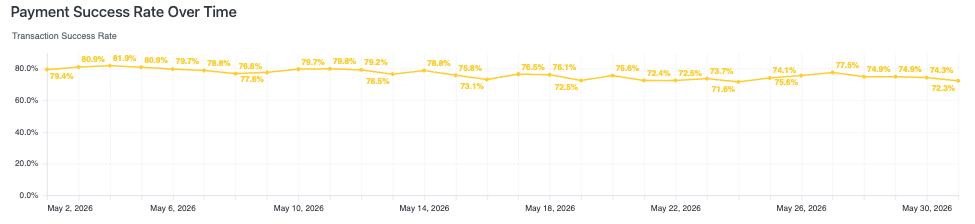
Payment success rate over time
This chart tracks your overall payment success rate over the timeframe in view, giving you a more detailed picture of how performance is trending.
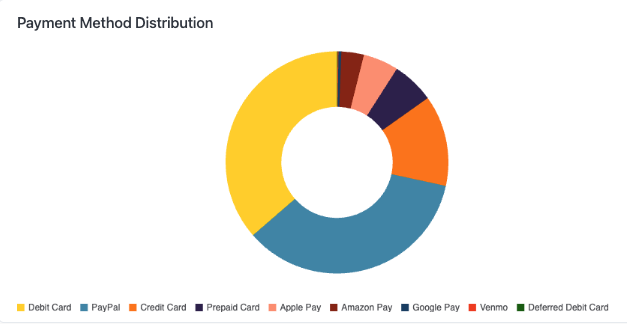
Payment method distribution
This chart breaks down every payment method accepted on your site, showing the relative distribution of transactions across each, giving you an instant read on how your customers prefer to pay.
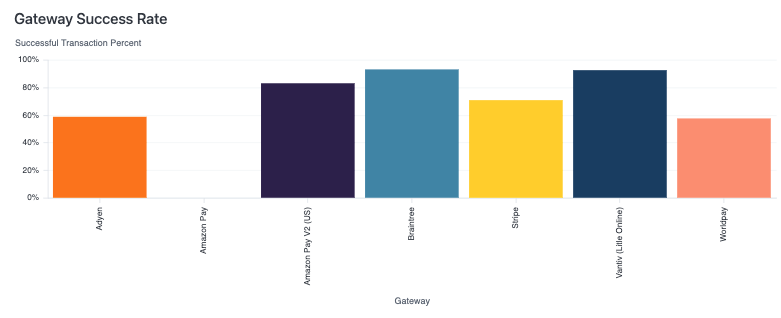
Gateway success rates
This graph breaks down payment success rates by gateway, giving you a side-by-side comparison of how each PSP is performing within your selected timeframe. Seeing performance isolated by gateway makes it easy to identify underperforming routing paths and validate the impact of gateway changes.
Payment method success rates
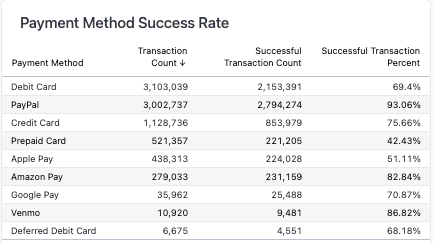
This card breaks down payment success rates by payment method, giving you a side-by-side comparison of how each performs independent of the gateway processing it. Isolating success rates at the payment method level helps you identify which methods are underperforming and understand whether declines are method-specific.
Card BIN success rates
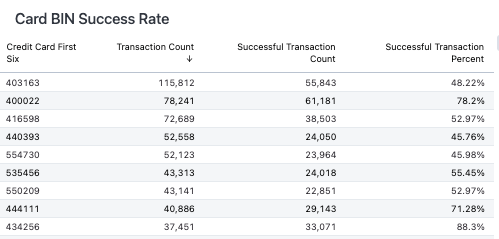
This card breaks down payment success rates by card BIN, surfacing the top-performing and most common BINs transacting on your site within a given timeframe. Visibility at the BIN level lets you identify whether specific card issuers or card types are experiencing higher decline rates, giving you the granularity needed to take targeted action — whether that's working with your gateway or flagging patterns.
Payment decline reasons
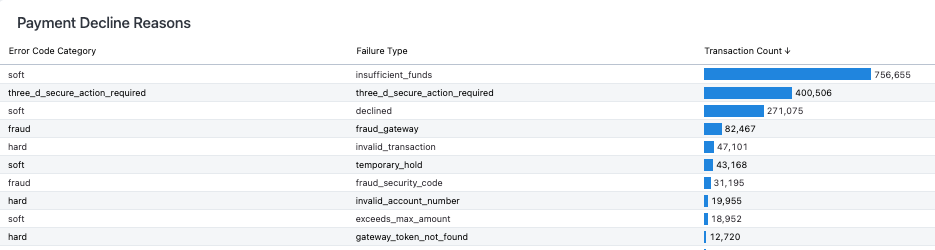
This table surfaces your top payment decline reasons, categorized by hard or soft decline type, and ranked by count, percentage, and associated dollar volume — giving you a comprehensive view of where and why payments are failing. Distinguishing between hard and soft declines is critical: soft declines often represent recoverable revenue through retries or account updates, while hard declines signal issues that require more targeted intervention, such as routing changes or issuer outreach.
Updated about 2 months ago