Payments Hub: Payment retry recovery dashboard
Track how much initially failed revenue is successfully captured through Recurly’s intelligent retry logic. Analyze your recovery rate and success-by-attempt distribution to determine if your dunning timeline is effectively salvaging revenue at risk.
Payment retry recovery dashboard
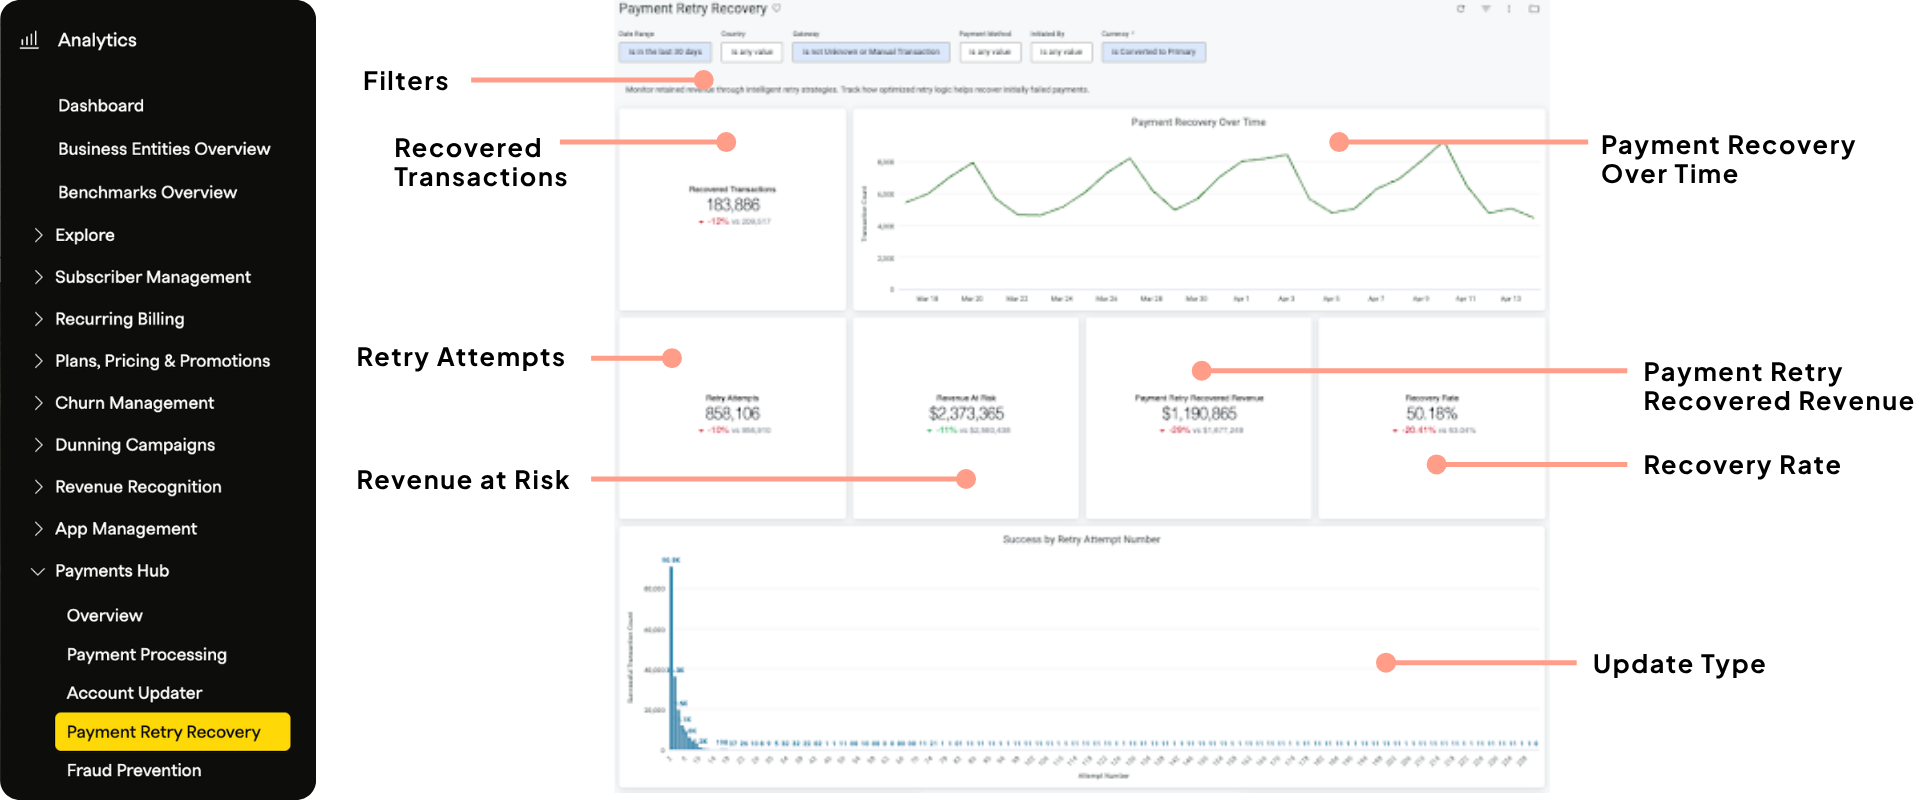
The Payment Retry Recovery dashboard shows how much initially failed revenue was recovered on subsequent payment attempts — and at which attempt it was captured.
Navigation Menu
 Payment retry recovery dashboard
Payment retries
When a payment fails on the first attempt, Recurly's intelligent retry logic works to recover it. This dashboard shows you how much revenue that recovery effort is capturing — and the story behind each retry attempt.
Payment Retry Recovery walkthrough
What's on this dashboard
Recovered transactions — Total count of payments successfully recovered through retries in the period.
Payment recovery over time — A trend line showing recovered transaction volume by day.
Retry attempts — Total number of retry attempts made in the period (a single transaction may be retried multiple times).
Revenue at risk — The total value of invoices attached to a dunning campaign whose first payment attempt failed. This is the pool of revenue eligible for recovery on subsequent attempts.
Payment retry recovered revenue — The dollar value successfully collected on the second or later payment attempt.
Recovery rate — The percentage of revenue at risk that was successfully recovered.
Success by retry attempt number — A chart showing which retry attempt (1st, 2nd, 3rd...) actually captured the payment. Most payments are recovered within the first several attempts.
This dashboard counts all successful payments on attempt 2+ as recovered, regardless of mechanism. The main Analytics dunning dashboards break recovery into named buckets (retry, Account Updater, backup payment, customer card updates, etc.) and may apply different filters. For example, some exclude manual dunning campaigns or include first-attempt successes in their totals. The numbers will not always match. This dashboard is the simplest view of "how much failed revenue did we eventually collect."
The "Success by retry attempt number" chart is one of the most useful views in Payments Hub. It shows the distribution of which retry number is capturing the payment. For most merchants, the bulk of recoveries happen within the first 10 attempts — which validates that your dunning timeline is appropriate and that recovery is working as expected.
Activity: Explore payment retry recovery
Payment retries activity
Want to optimize your retry strategy?
Join Global Office Hours to talk through your retry recovery data with a CSM. We can help you understand what your numbers mean in context and identify opportunities to improve.
Register for Office Hours →Resources
Updated 10 days ago