Explore - Invoices and workbook agent
The Invoices Explore feature is a is an interactive analytics tool that lets you slice and filter invoice-related data across accounts, subscriptions, plans, dunning events, and more to create custom reports. Use the Workbook Agent to ask natural-language questions and get AI-assisted analysis.
Overview
Required plan
This feature may not be included in the Starter or Pro plans. If you are interested, please contact Recurly Sales to discuss upgrade options.
Prerequisites
- Users must have Analytics user role permission.
Definition
The invoices Explore feature is a dynamic, versatile, and powerful tool that provides a custom view of your organization's data. It transforms raw data into insightful and actionable information, catering to a wide array of data needs. From invoice details to account information and various other fields, Explore allows you to delve deeply into your Recurly data.
Key benefits
- Customizable reports for actionable insights: Recurly Explore provides flexible report-building capabilities, allowing you to create custom reports tailored to your specific business needs.
- Comprehensive data views for deep analysis: From accounts to transactions, Explore offers predefined data views, enabling you to analyze every aspect of your Recurly data.
- Optimized decision-making through detailed metrics: Use dimensions and measures to uncover patterns and make informed decisions that enhance business performance.
- AI-assisted analytics: Use the Workbook Agent to ask data questions in plain language. The agent interprets your question, selects the relevant fields, and returns a result set or chart.
Key details
The invoices Explore includes all invoices and their corresponding line items. It does not contain transaction or gateway information. The data provided is particularly useful for building reports related to invoicing or accounting. Note that gateway, fraud, error code, or payment method information is not included in this Explore.
With the Recurly invoices Explore feature, you can easily create custom reports and visualize the data that matters most to your business.
Explore interface
The Explorer is divided into three areas:
| Interface Area | Description |
|---|---|
| Left panel -Workbook | Agent Ask natural-language questions about your invoice data. The agent suggests fields and runs queries on your behalf. |
| Center panel - Field picker | Browse and search the full field catalog. Fields are grouped by topic. Click any field to add it to your active query. Use the In-use filter to see only selected fields. |
| Right panel - results area | Toggle between Results (table view), Chart (visualization), or Both. Use the Options tab to configure axes, grouping, and chart type. Click Preview to run a sample query and verify your field selection before committing. |
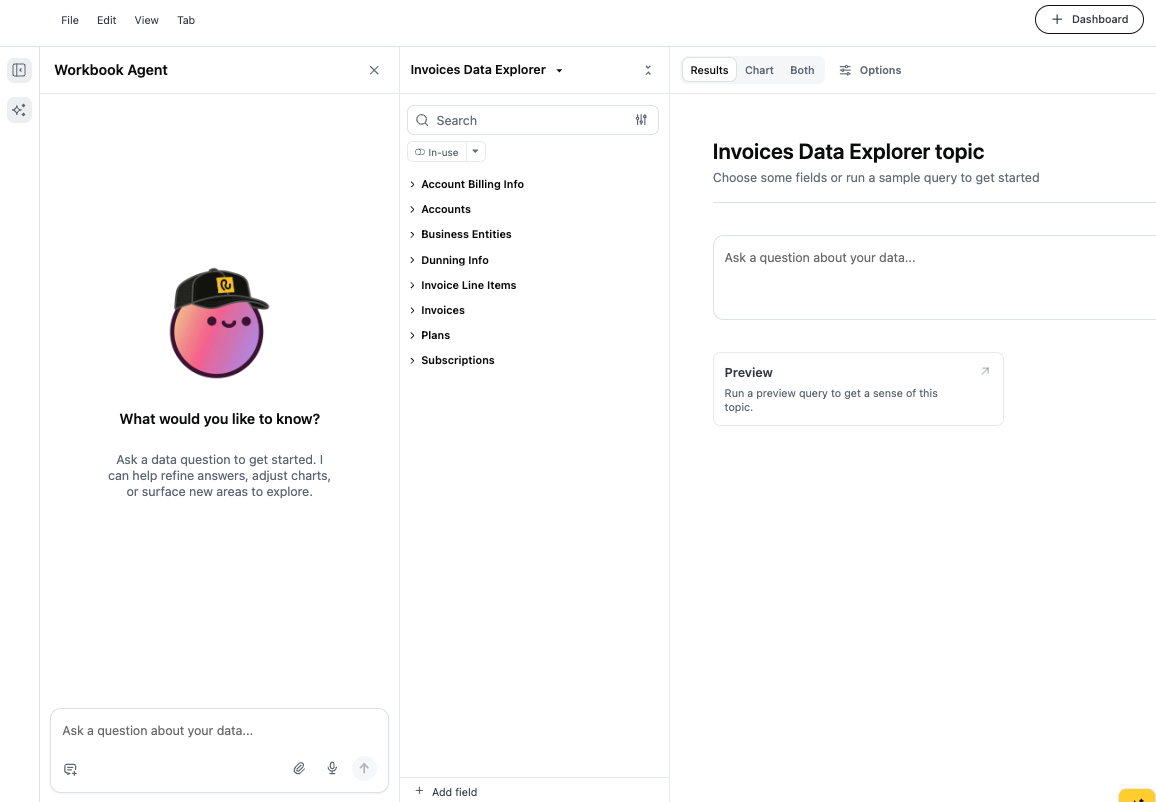
Using the Workbook Agent
The Workbook Agent is the fastest way to start an analysis. Type a question in the text box at the bottom of the left panel and press Enter (or click the send icon).
Example prompts:
- "Show me total invoice revenue by plan for the last 30 days"
- "Which accounts have open invoices older than 60 days?"
- "Break down failed charges by dunning state this month"
- "How many invoice line items are associated with add-ons?"

Switching between Agent and manual mode
You can use the Agent and the field picker together. After the agent populates a query, you can add or remove fields manually using the center panel. Changes are reflected immediately in the results view.
Opening an existing report
- Click the yellow Recurly logo in the upper left corner of the Explore

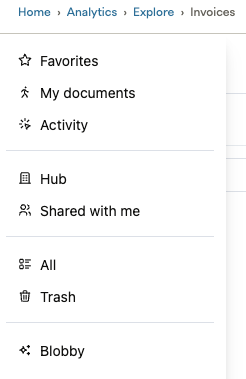
- Either go to My documents or the Hub to access saved reports. My documents stores your private personal data reports and folders while the Hub is the shared workspace for the entire site.
- Click on the folder or report to open
- Select File-Edit or click the Edit button in the upper right corner to edit the report.
- Save your updates by selecting File-Save.
Run/refresh a report with or without cache
- Once in an existing report, you can run or refresh the report with or without cache by selecting the View menu
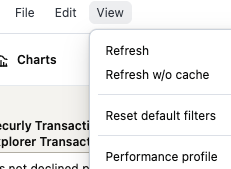
- Refresh - this re-runs or refreshes the report against previously saved data. As an example, If you (or a colleague) ran the exact same query with the same filters, sorts, and fields within the last 1 hour, Explore will instantly load those pre-saved results. It only sends a new query to your data source if the cache has expired or if filters, sorts, and/or fields are changed in the report.
- Refresh w/o cache - this bypasses the stored query results for the report and sends a direct query to your data source to pull live, up-to-the-minute data.
Creating a new report
- Browse and search the full field catalog. Fields are grouped by data topic.
- Click any field to add it to your active query. Use the In-use filter to see only selected fields.
- Toggle between Results (table view), Chart (visualization), or both.
- Use the Options tab to configure axes, grouping, and chart type.
Available data
The field picker organizes all available dimensions and metrics by topic. Each topic maps to a set of underlying data entities:
| Data | Description |
|---|---|
| Account Billing Info | Payment method details, billing address and card metadata associated with accounts |
| Accounts | Account-level attributes including account code, email, address, name, etc |
| Business Entities | Legal entity data for multi-entity merchants, including entity name and tax region. |
| Dunning Info | Retry attempts, dunning state, and communication timing for failed payment recovery. |
| Invoice Line Items | Individual charges and credits at the line level, including unit amounts, quantities, and product codes. |
| Invoices | Invoice totals, state (open, collected, failed, voided), currency, and dates. |
| Plans | Plan codes, names, intervals, and pricing tiers. |
| Subscriptions | Subscription state, start/end dates, trial info, and associated plan and add-on metadata. |
Tips & best practices
- Use Preview before adding many fields — it confirms the data shape without running a full query.
- The In-use toggle in the field picker narrows the view to your current selection, making it easier to review what's included.
- Save frequent queries as a Dashboard using the button in the top-right corner so teammates can access them without rebuilding.
- For large date ranges, start with aggregated metrics (totals, counts) before drilling into line-level detail to keep load times fast.
- The Workbook Agent works best with specific, scoped questions. Include a timeframe and at least one entity type (account, plan, subscription) for the most accurate results.
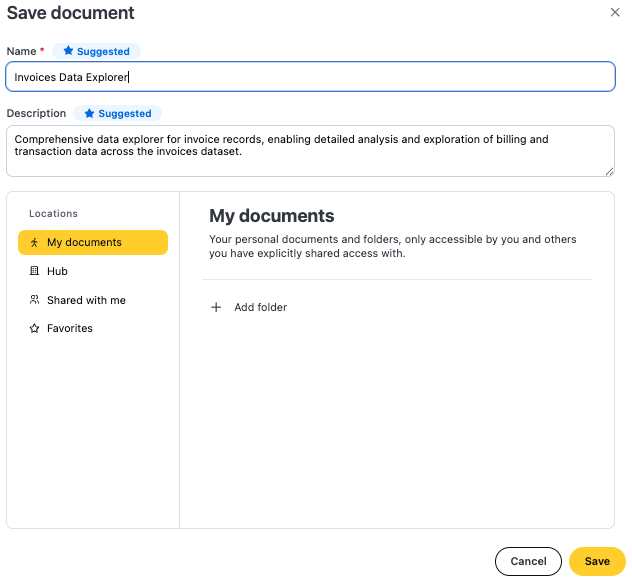
Saving a report
To save an explore:
- In the workbook, click File > Save.
- Give the document a Name and an optional Description
- Use the Locations browser to find and select the folder you want to save the document to. The document can be moved after saving if needed.
- Click Save to save the document.
Updated about 1 month ago