
Billings
Learn how to use Recurly's Billings dashboards to track payments, refunds, and net billings by region, country, and state.
Prerequisites
- Users must have Analytics user role permission.
Definition
The dashboards also break billings down by region, so you can tailor your approach to each market. Available regional views:
- Billings (Global)
- Billings (North America)
- Billings (Europe)
- Billings (Asia)
- Billings (South America)
- Billings (Oceania)
- Billings (Africa)
Key benefits
Key details
Billing key performance indicators (KPIs)

This widget gives you a detailed breakdown of your payment totals to date. Compare month-to-date totals against last month, two months ago, three months ago, and even one year ago.
Summary
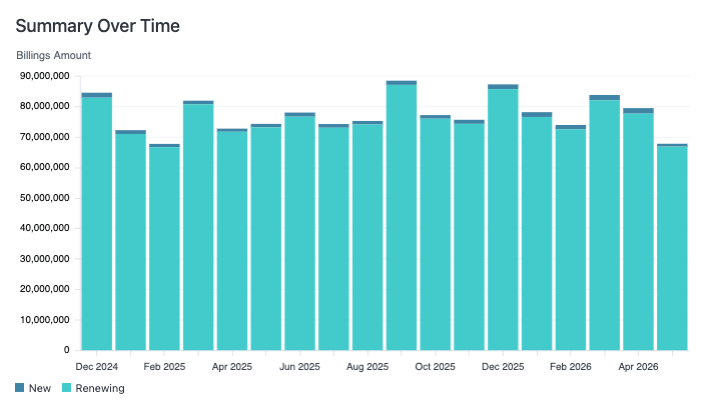
This chart brings together new and renewing customer payments and refunds over your chosen date range, so you can see the full shape of your billing cycle — transactions coming in and refunds going out.
New vs renewing detail
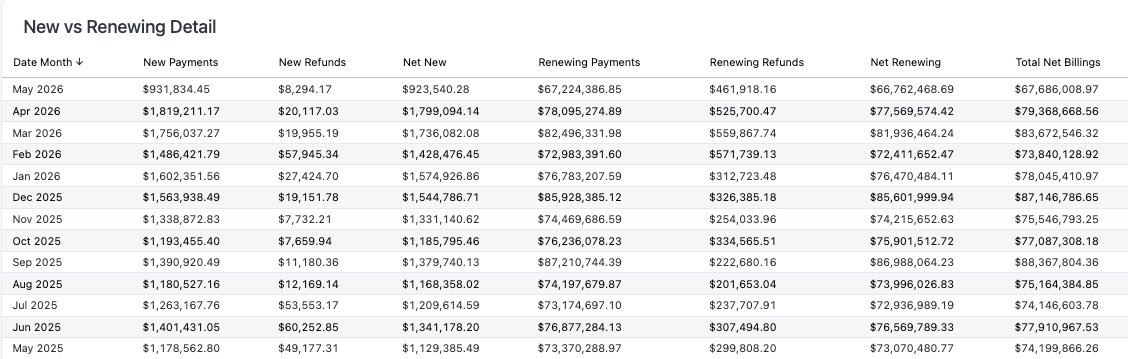
The Net Billings dashboard compares net new and net renewing payments side by side:
- Net new: New payments minus any new refunds.
- Net renewing: Renewing payments minus renewing refunds.
Together, these two values make up your Total Net Billings.
For clarity, within this dashboard:
- "New" refers to a subscriber's first payment.
- "Renewing" covers any payment made after that first one.
Billing drills
In the Summary and New vs Renewing detail charts, select any bar or number to access two drills:
- Product details: A summarized view of the invoice line items, including a breakdown of the products contributing to the total for the selected billing record. Minor differences may appear between this total and the dashboard value due to currency conversion and tax rounding. For more detail, drill further into transaction and invoice details for each product total.
- Transaction and invoice details: All transactions and their associated invoices that contribute to the total for the selected billing record, shown in the transaction currency.
Billings by country
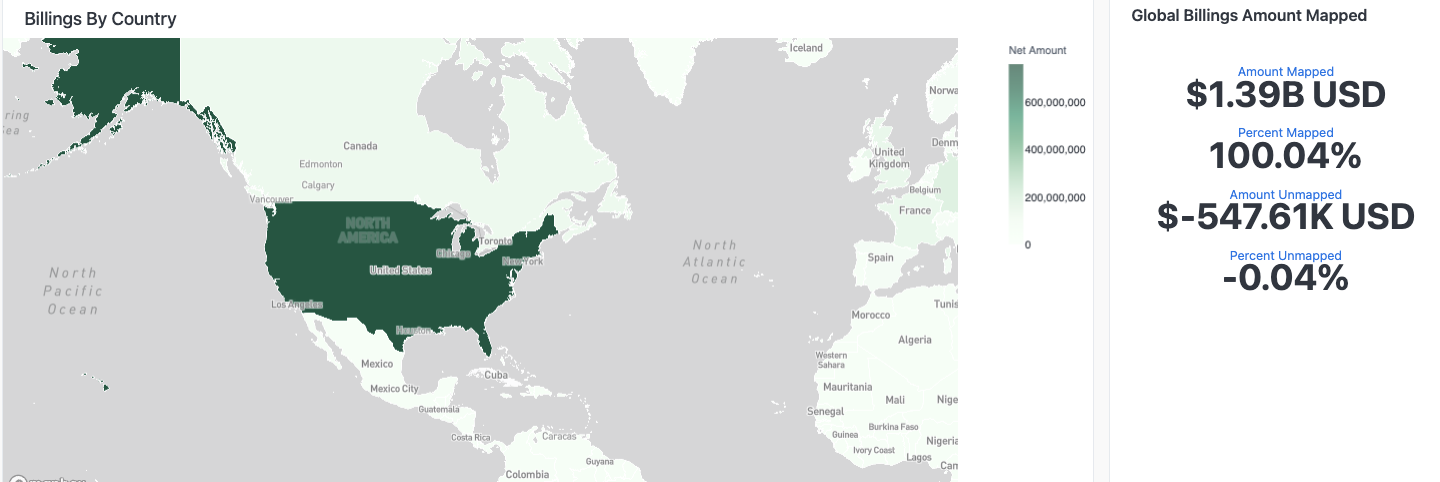
An expanded version of the by-state map at a global level. Select an individual country to see its total payments. Transactions without an assigned country are grouped into the Amount Unmapped box below the map, helping you understand your international reach and spot untapped potential.
Billings by state
This dashboard shows a geographic breakdown of payment amounts by state. Location is determined from the account's billing information or, when that's unavailable, the IP address — a straightforward way to understand regional revenue distribution.
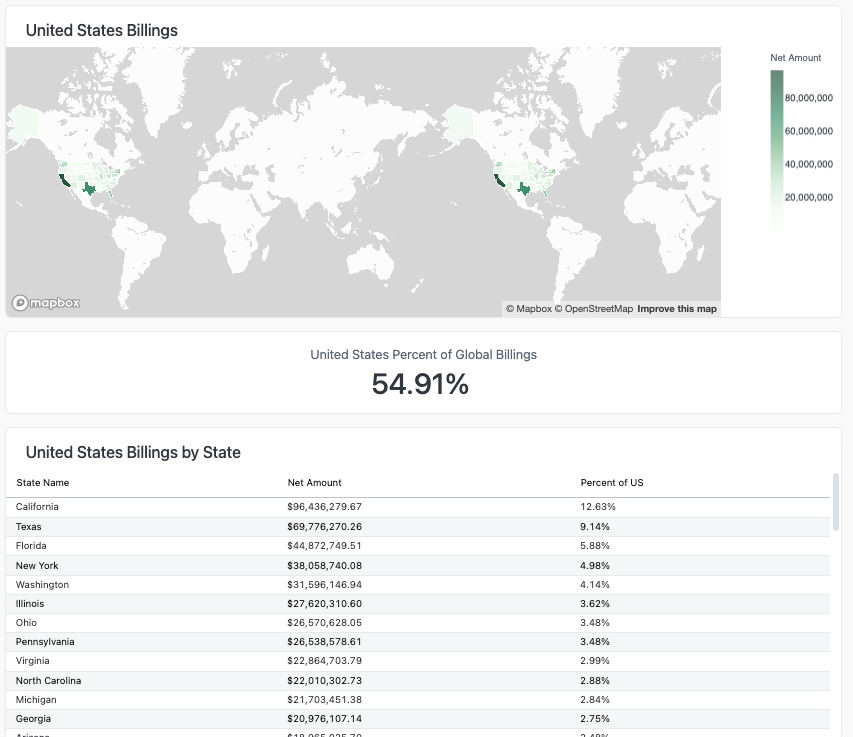
The current version covers:
- Billings by state: Revenue distribution across different states.
- Billings by country in Europe: Revenue distribution across European countries.
Adjacent widgets show the percentage of global billings for each region, and a table below lists each country or state within its region.
Using the geographic charts
The Billings dashboard includes territory-shaped charts for different geographic areas. Select a territory on the map to see total payments, refunds, and net billings for that state or country in the hover text.
Below the maps, two boxes break down mapped and unmapped amounts. Mapped transactions have been assigned to a specific state or country; unmapped transactions haven't. This helps you see where your transactions are coming from, and catch any that might be miscategorized.
Updated 2 months ago