
Dunning campaigns dashboards
Learn how to use Recurly's Dunning Effectiveness dashboards to monitor, compare, and optimize your dunning campaigns' revenue recovery performance.
Prerequisites
- You must have the Analytics user role permission.
Definition
Dunning effectiveness charts
Dunning Effectiveness offers eight view configurations grouped into three sections, letting you analyze your dunning campaigns from every angle. The information available depends on the dunning campaigns created and active in your system.
All dunning campaigns
By invoices
This section gives you a comprehensive view of invoice recovery performance across all your dunning campaigns.
KPIs
These indicators give you a snapshot of your total past due invoices and recovery rate, so you can track changes over time and make informed decisions about your dunning strategies.

Invoice recovery rate
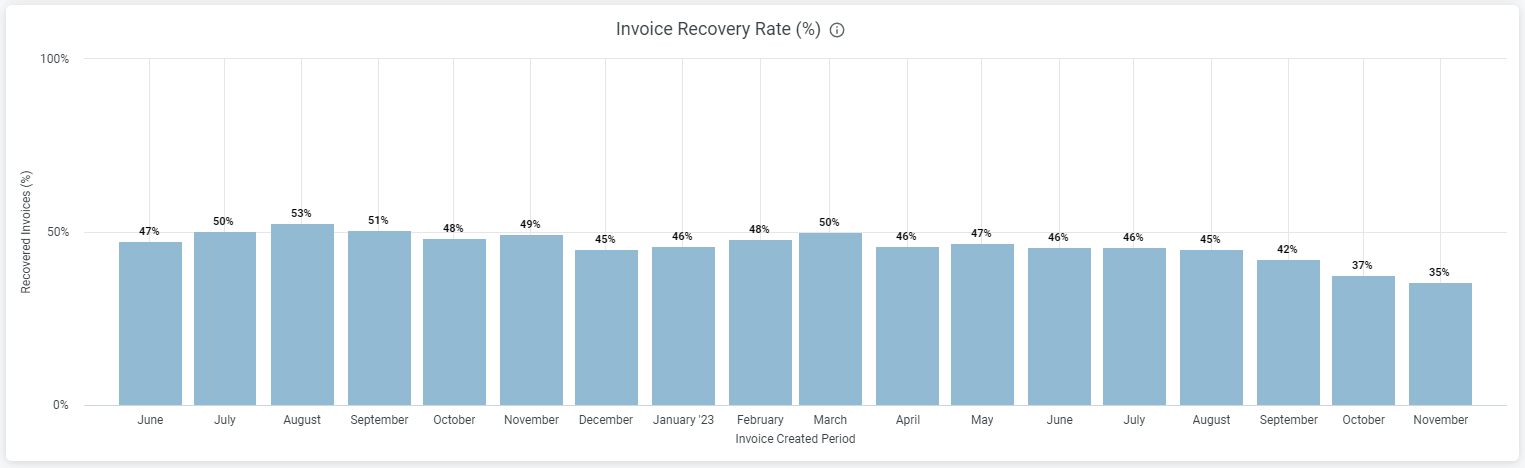
This chart shows the recovery rate of invoices that went past due during the selected date range — a valuable gauge of your overall recovery efforts.
Recovery reasons
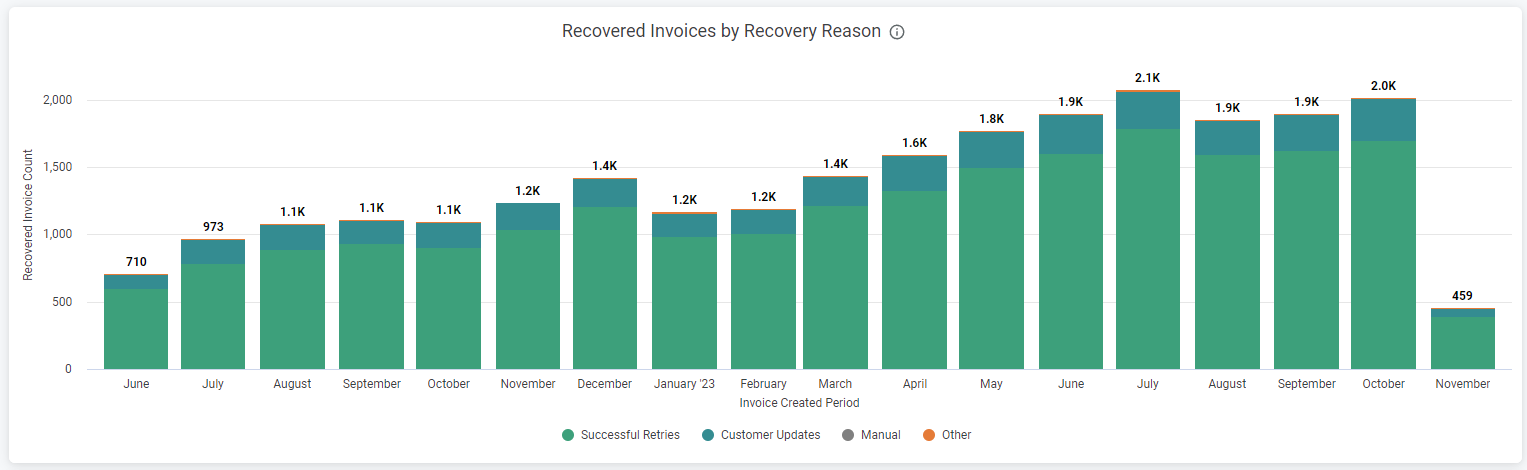
In both the Invoice by Recovery Reason and Dunning Life Cycle by Day charts, recoveries are grouped into four categories:
- Successful retries — Invoices collected after one of Recurly's static or intelligent retry attempts.
- Customer updates — Invoices recovered because the customer updated their own payment information, often in response to a dunning email.
- Manual — Invoices recovered through direct action by your team, such as manually updating the payment method on file or marking an invoice as paid.
- Other — Invoices that don't cleanly fit into the categories above. Common examples include:
- Expiration management — When a card's expiration date is automatically updated, causing the invoice to be recovered without a direct customer or manual update.
- Account Updater (post-dunning) — If an invoice has already entered dunning, any successful collection attempt — whether prompted by Account Updater or otherwise — is reported as a retry in analytics. As a result, post-dunning Account Updater recoveries may appear in your dashboards under Other (or "retry") rather than under an explicit "account_updater" label.
Invoice recovery by reason
This breakdown shows the reasons for invoice recovery, giving you insight into where your strategies are most effective.
Dunning lifecycle by day
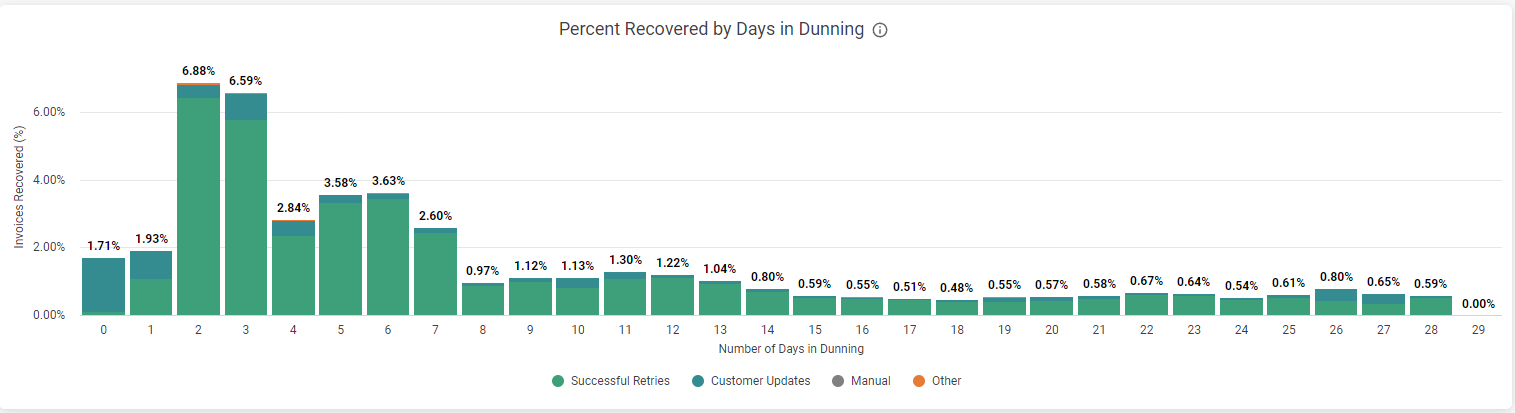
This chart tracks the recovery of revenue over time, helping you understand the efficiency of your dunning strategies across the dunning lifecycle.
By revenue
This view focuses on the financial impact of your dunning campaigns.
KPIs
These indicators focus on past due and recovered revenue, so you can assess the financial effectiveness of your dunning efforts.

Dunning recovered revenue by recovery reason
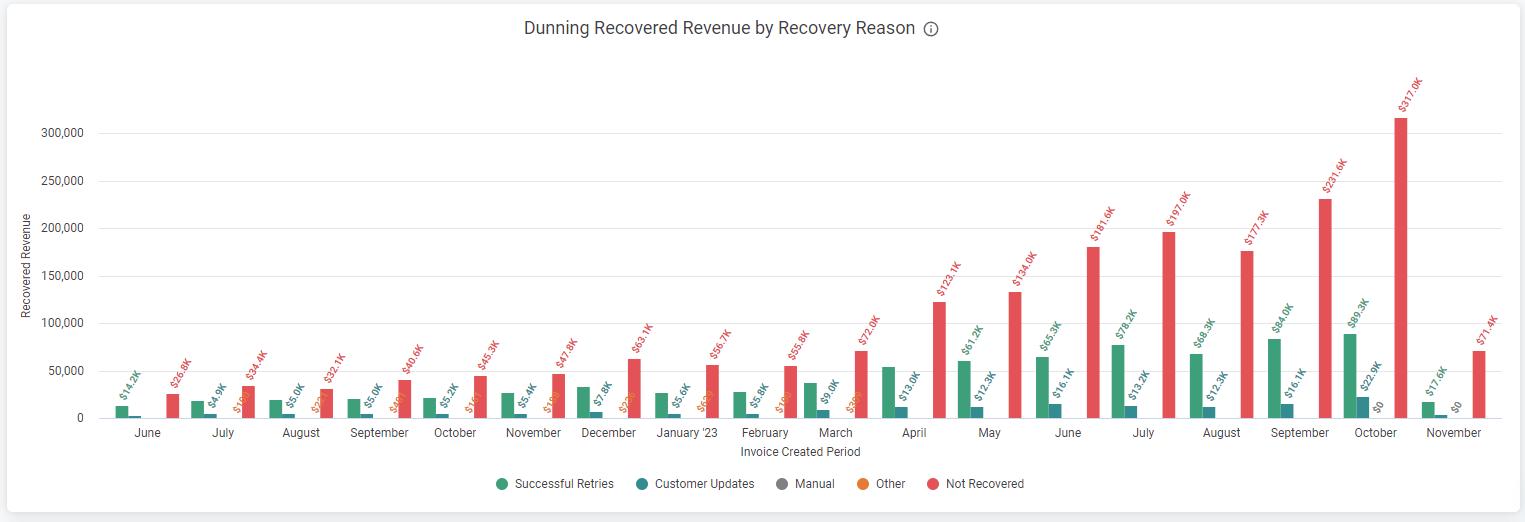
This chart breaks down recovered revenue by reason, helping you identify which parts of your recovery strategy are most financially successful.
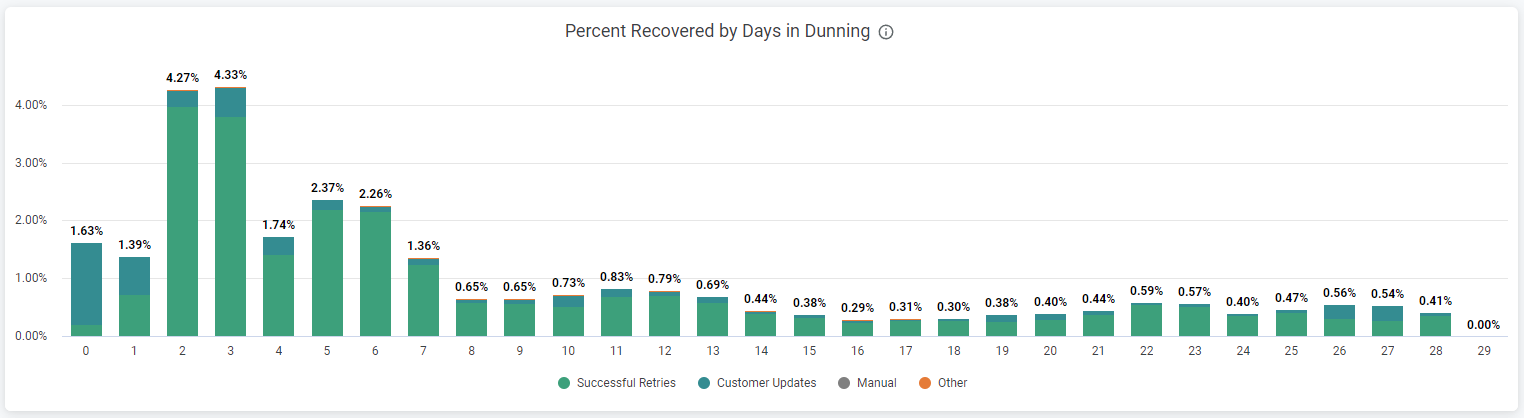
Dunning lifecycle by day
This chart tracks the recovery of revenue over time, helping you understand the efficiency of your dunning strategies across the dunning lifecycle.
By subscriptions
This view focuses on how dunning campaigns affect your subscription numbers.
KPIs
These indicators revolve around subscriptions, including the number past due and saved, so you can assess the effect of your dunning campaigns on your subscriber base.

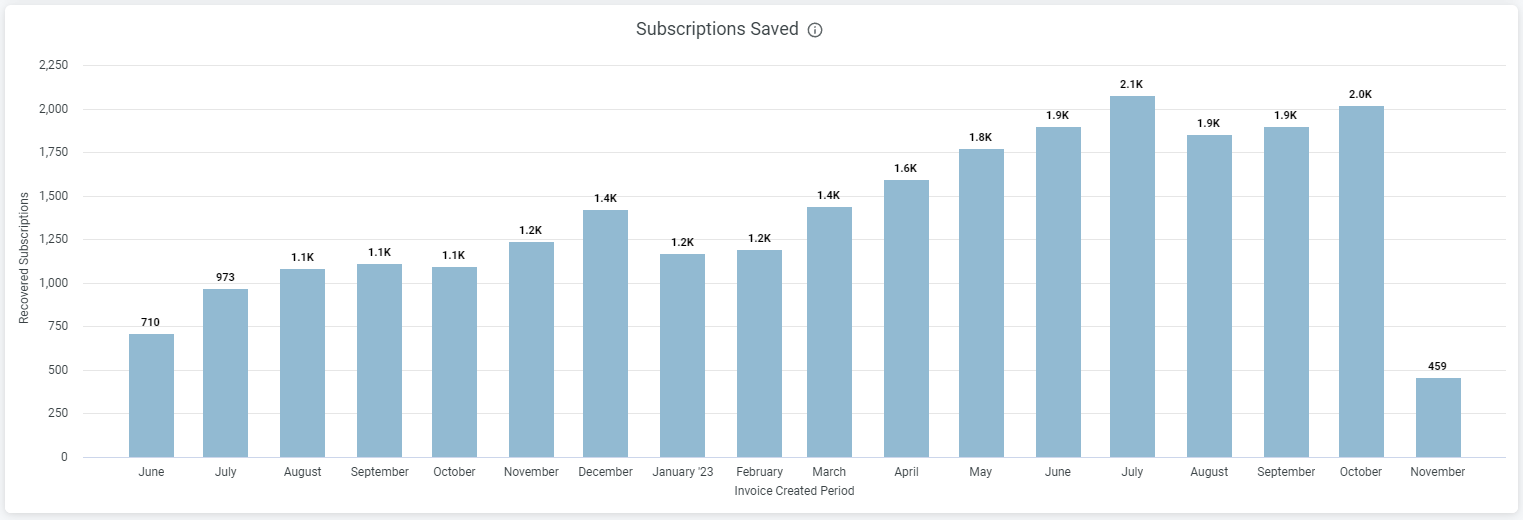
Subscriptions saved
This chart shows the total number of subscriptions saved through your dunning efforts.
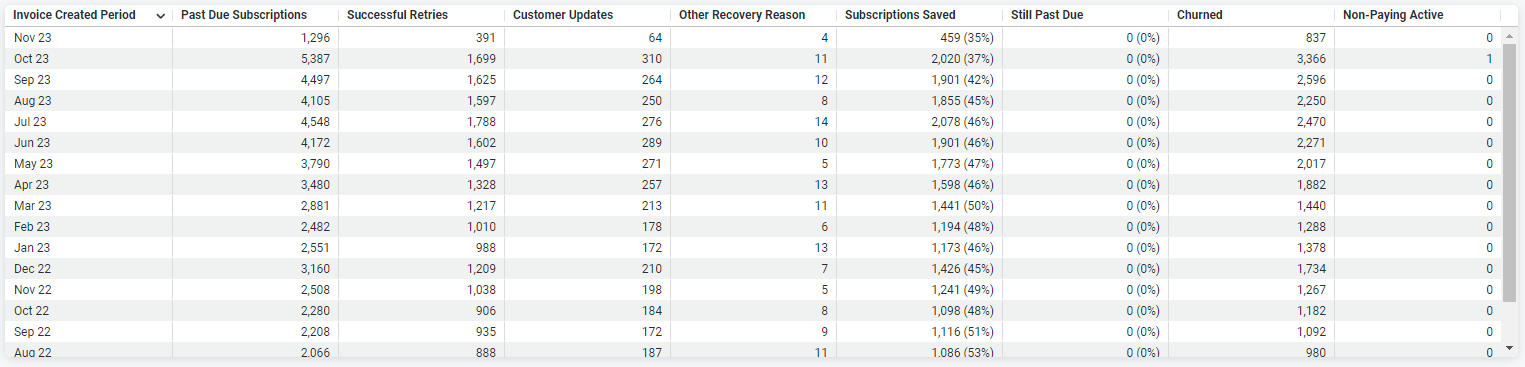
Subscriptions saved by recovery reason
This breakdown shows the reasons for subscription recovery, helping you refine your dunning strategies.
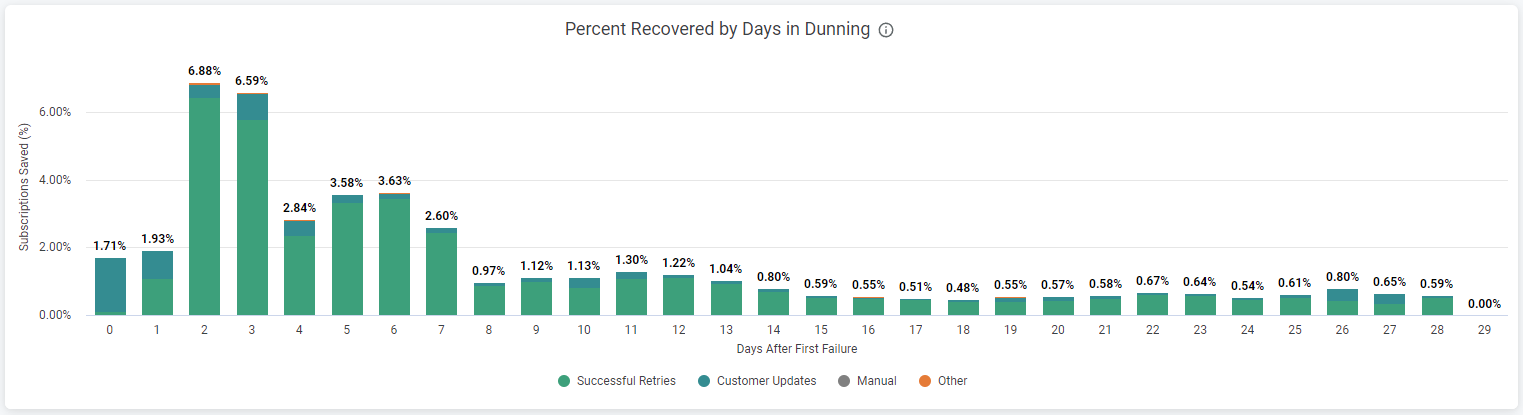
Dunning lifecycle by day
This chart tracks the number of subscriptions recovered over the dunning cycle, giving you a sense of when most recoveries occur.
Individual dunning campaigns
By invoices
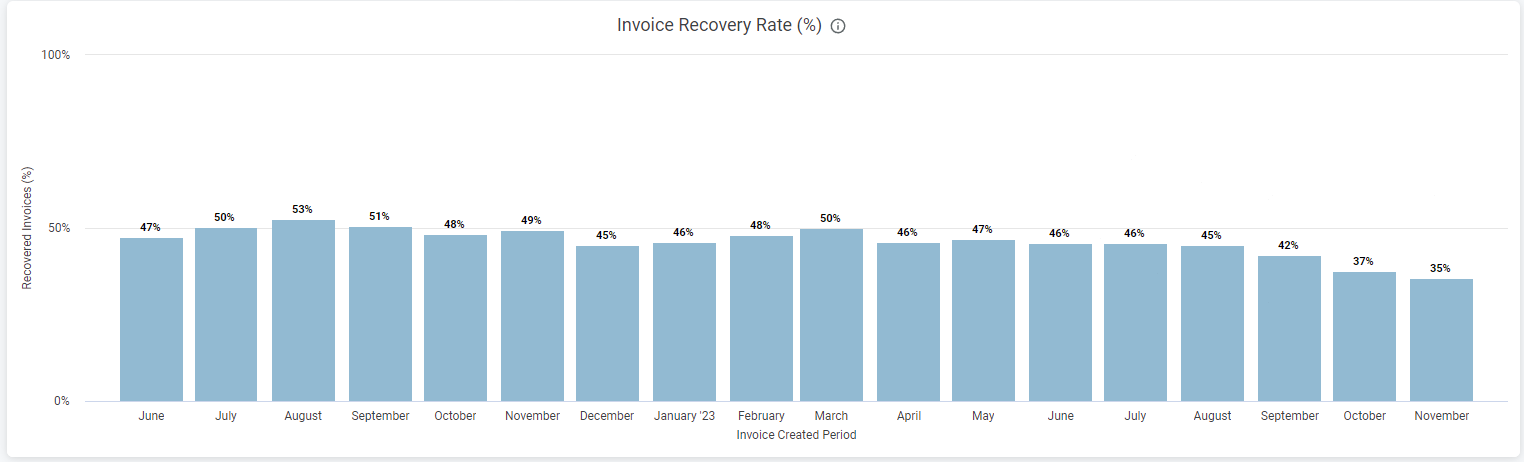
Invoice recovery rate
This chart tracks the recovery rate of invoices for a specific dunning campaign.
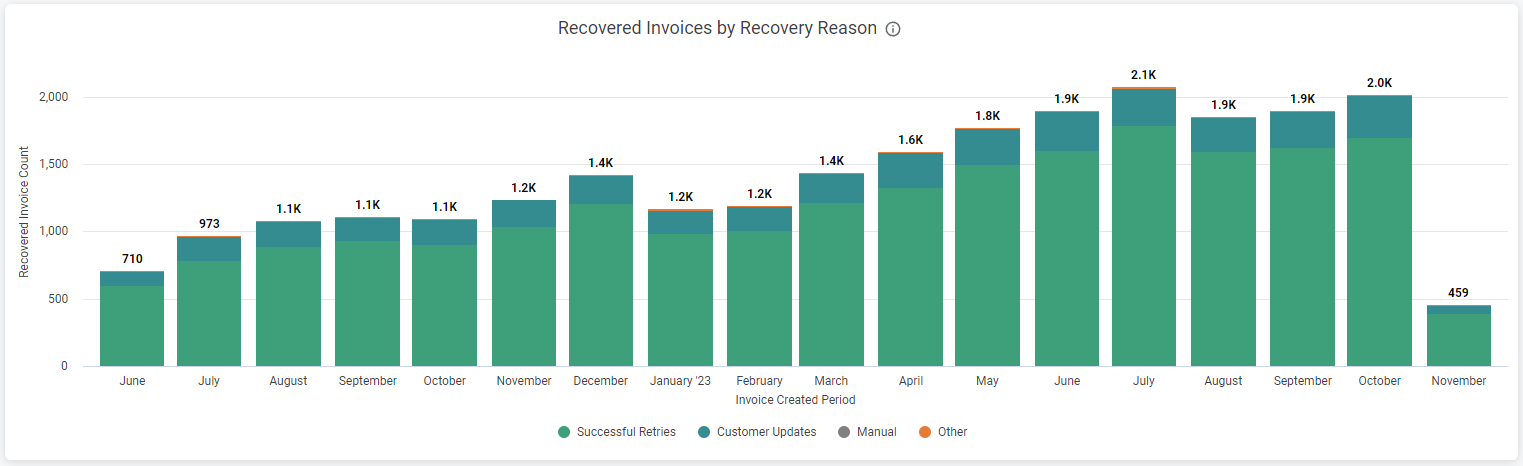
Invoice recovery by reason
This breakdown shows recovered invoices by reason for an individual campaign.
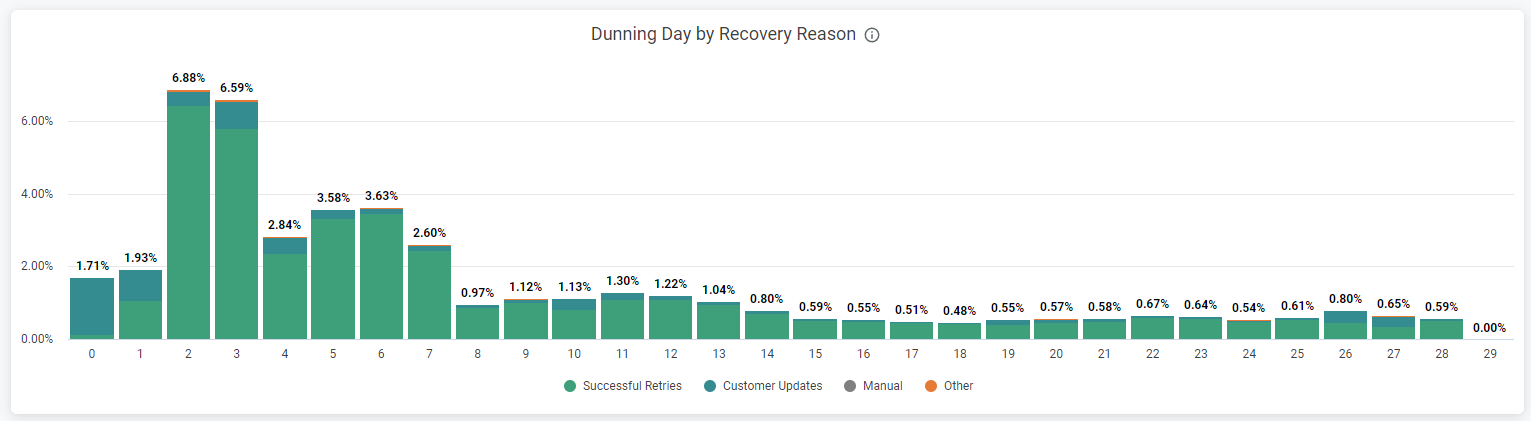
Dunning lifecycle by day
This chart tracks the recovery of revenue by recovery reason over the dunning lifecycle for a specific campaign.
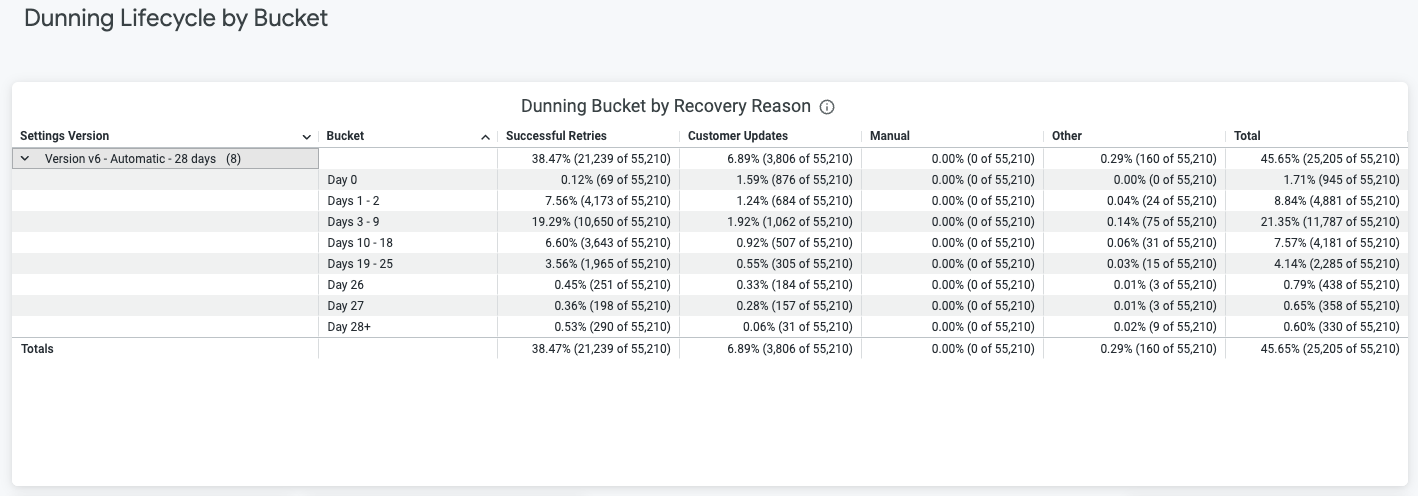
Dunning lifecycle by bucket
This table shows when during the dunning cycle subscriptions are most commonly saved for a specific campaign.
By revenue
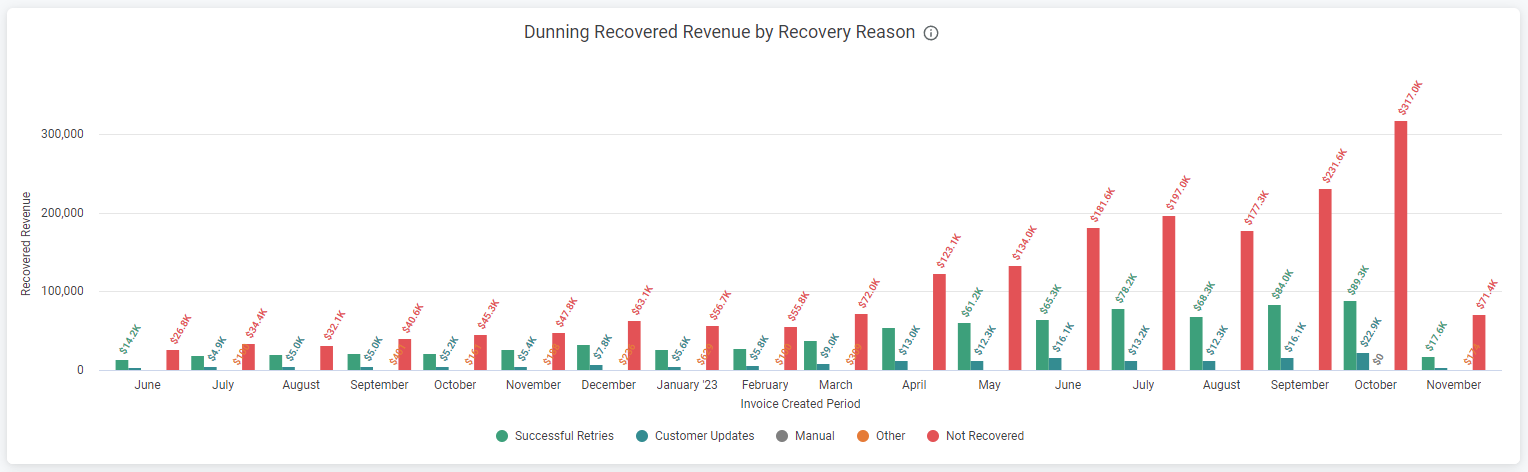
Dunning recovered revenue by recovery reason
This chart breaks down recovered revenue by reason for an individual campaign.
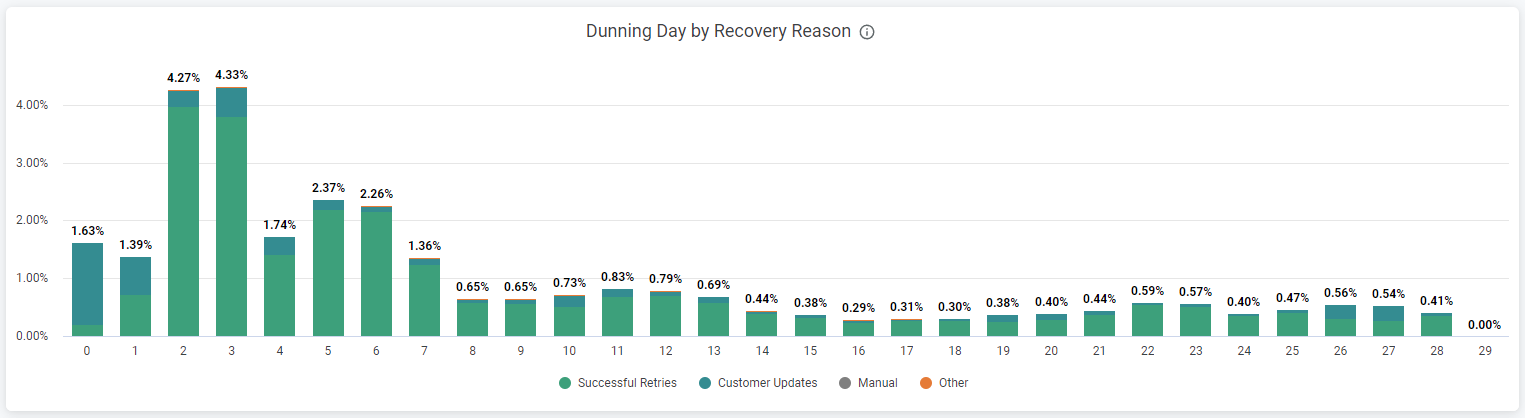
Dunning lifecycle by day
This chart tracks the recovery of revenue over the dunning lifecycle for a specific campaign.
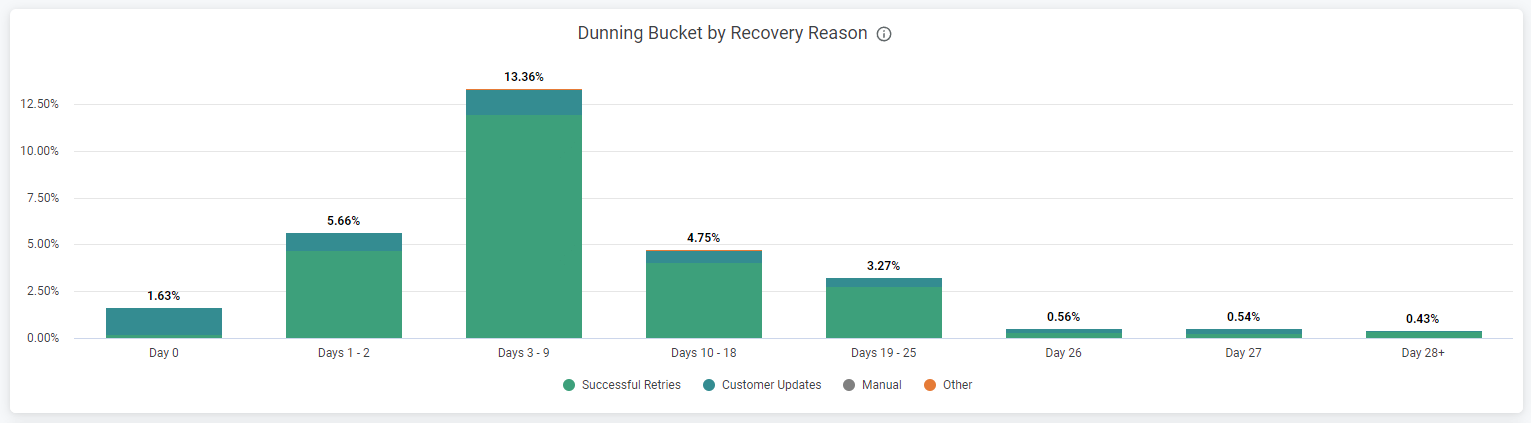
Dunning lifecycle by bucket
This chart shows when during the dunning cycle subscriptions are most commonly saved for a specific campaign.
Dunning lifecycle by day (by recovery reason)
This chart tracks the recovery of subscriptions over the dunning lifecycle for a specific campaign.
By subscriptions
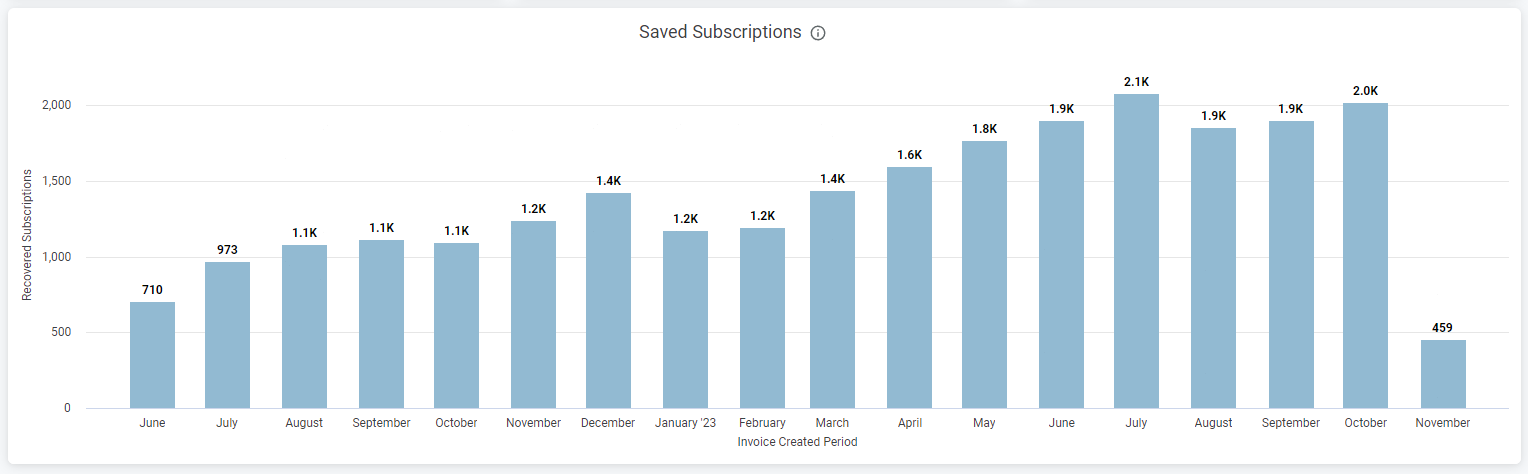
Saved subscriptions
This chart shows the total number of subscriptions saved through a specific dunning campaign.
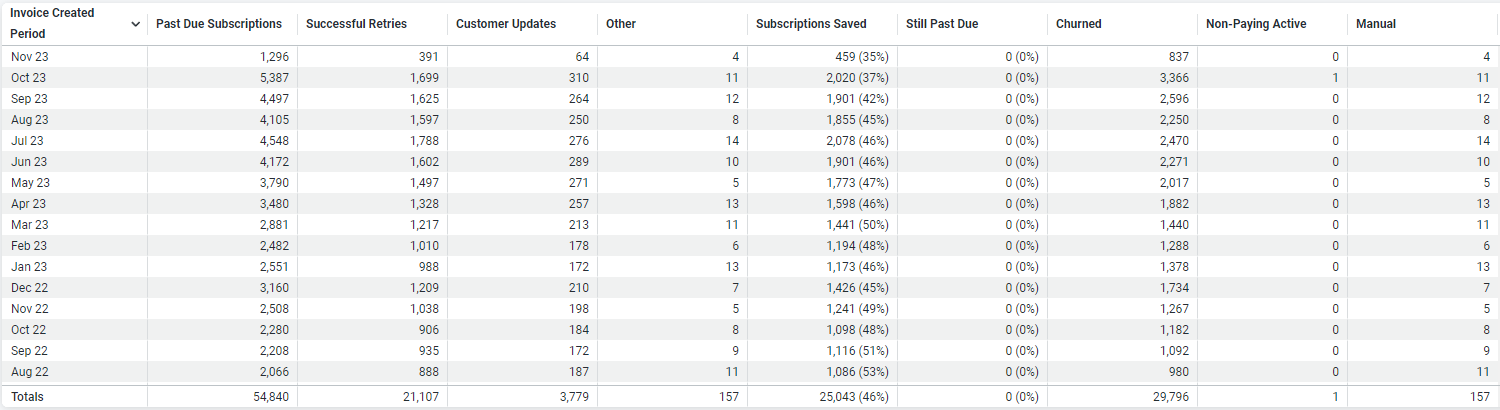
Subscriptions saved by recovery reason
This breaks down saved subscriptions by reason for an individual campaign.
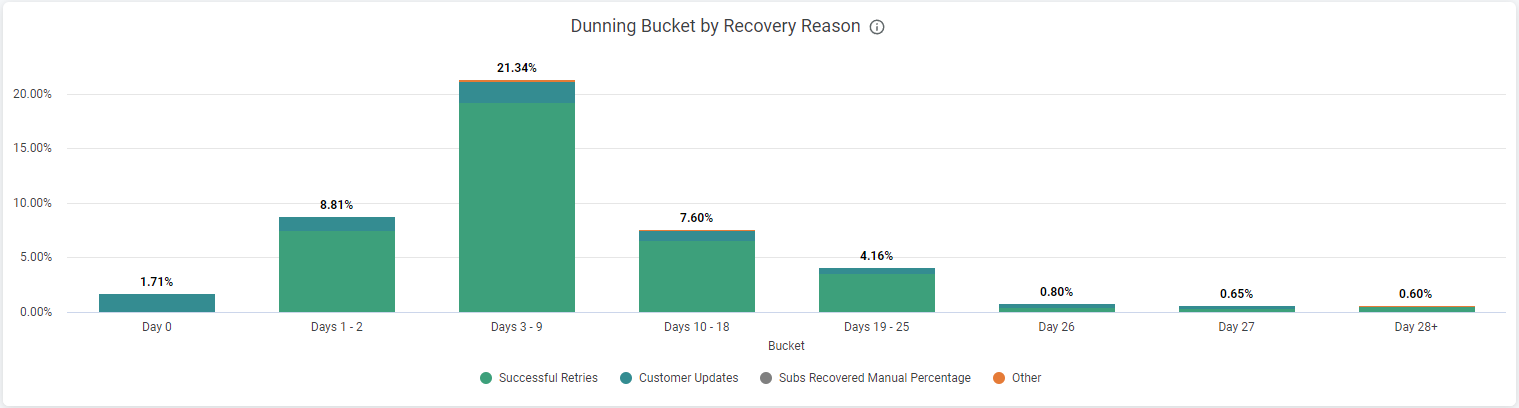
Dunning lifecycle by bucket
This chart shows when during the dunning cycle subscriptions are most commonly saved for a specific campaign.
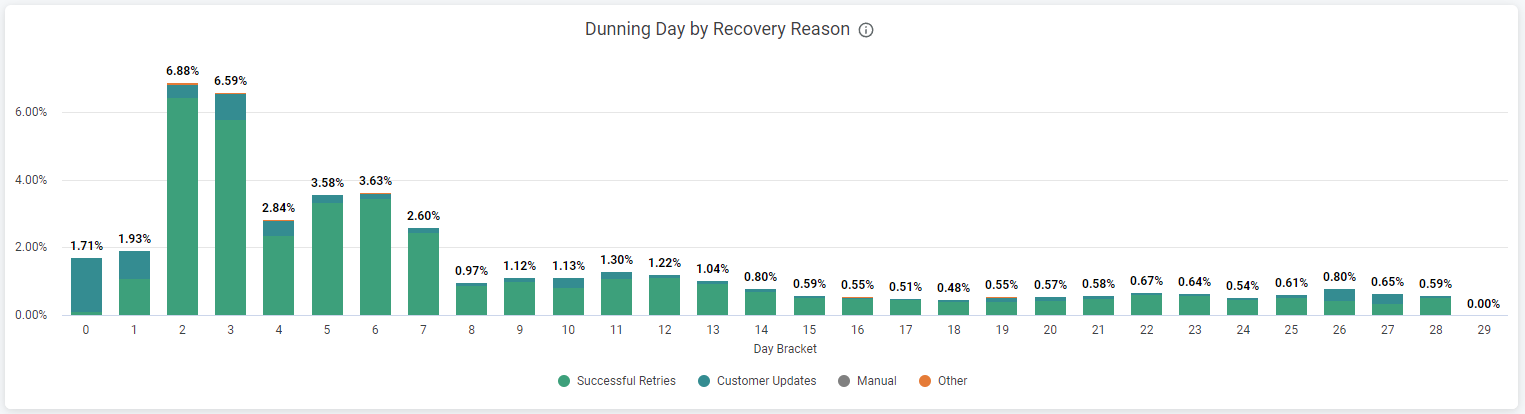
Dunning lifecycle by day (by recovery reason)
This chart tracks the recovery of subscriptions over the dunning lifecycle for a specific campaign.
Compare dunning
This section lets you compare the effectiveness of different versions of a campaign, or different campaigns altogether.
By versions
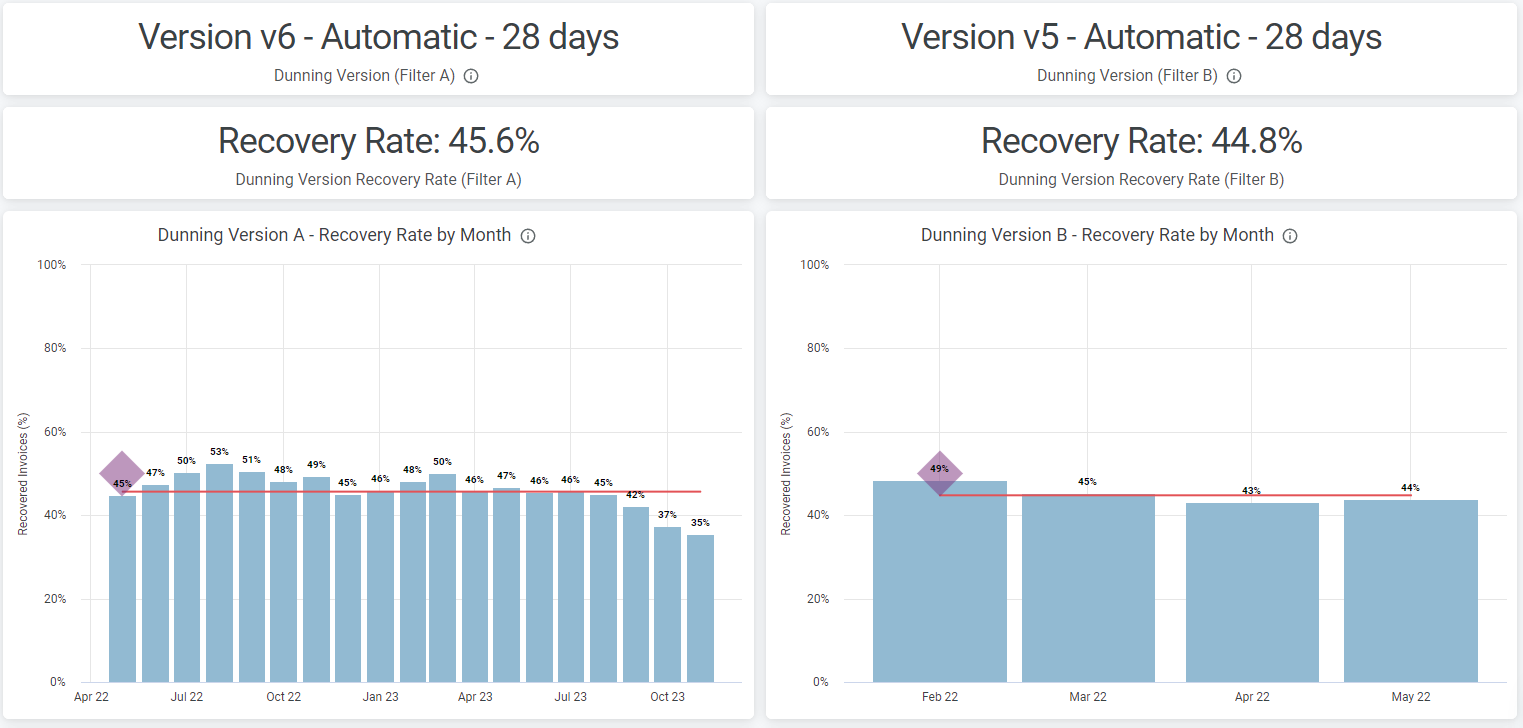
Recovery rate
This comparison between two versions shows their respective recovery rates and durations, alongside a month-by-month breakdown for each.
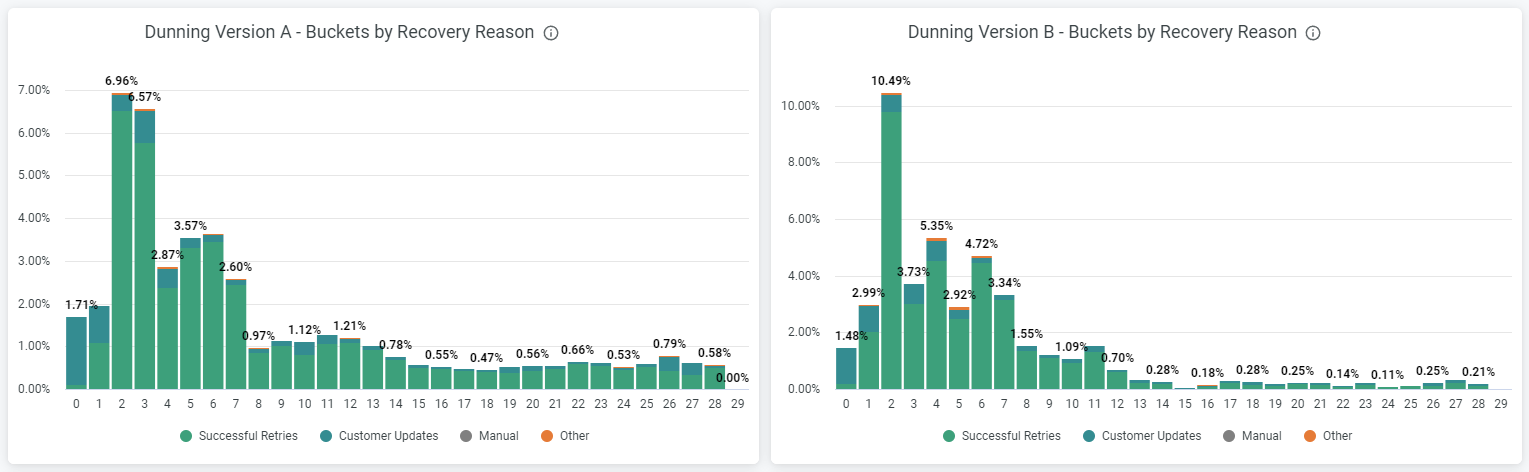
Dunning lifecycle by day
These charts let you compare when recoveries typically occur in the lifecycle of each version.
By campaigns
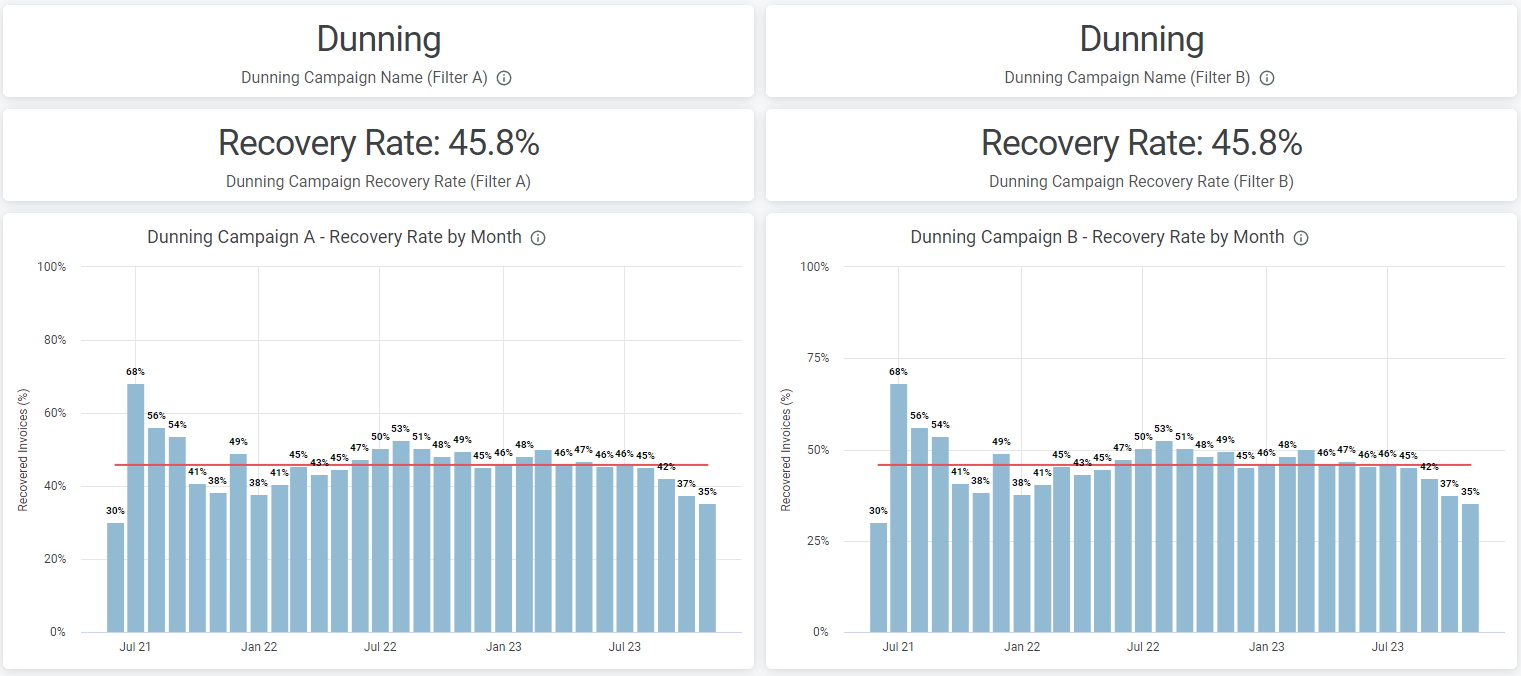
Recovery rate
This comparison between two campaigns shows their respective recovery rates and durations, alongside a month-by-month breakdown for each.
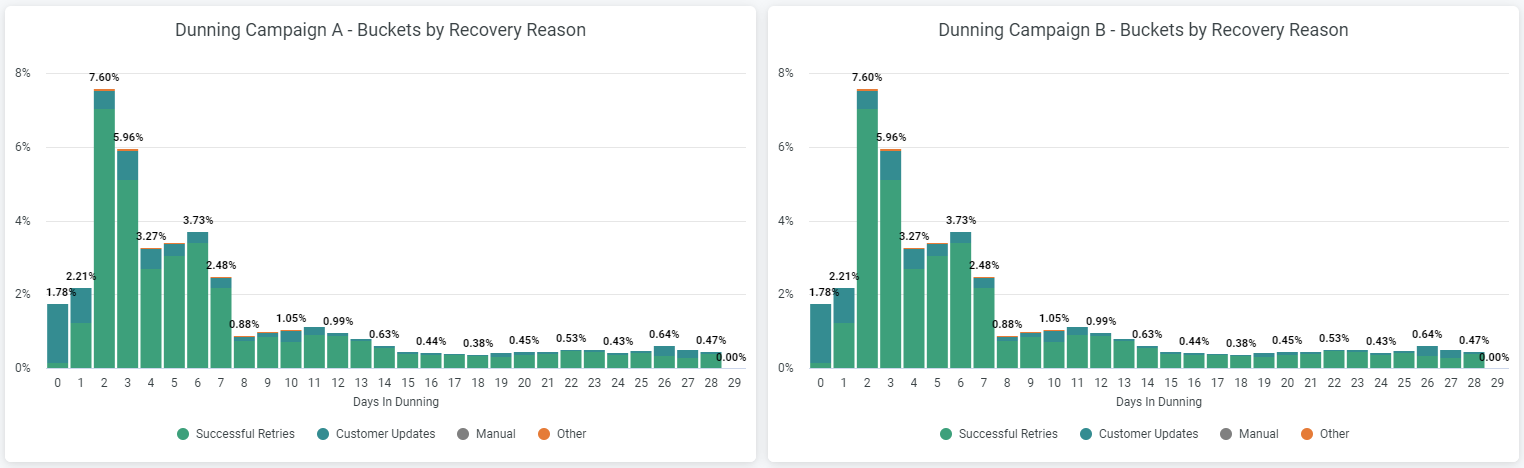
Dunning lifecycle by day
These charts let you compare when recoveries typically occur in the lifecycle of each campaign.
Using the dunning effectiveness dashboard
Interact with the dashboard actions
The actions are in the top right corner of the dashboard. Use them to refresh your data, hide filters, clear the cache, download the dashboard, reset filters to their default settings, or open folders from the dashboard. These actions keep you working with the most current, relevant data.
Apply filters
Use the filters in the top left corner to refine the displayed data. Adjust the time frame for subscriber data (daily, weekly, monthly), choose a metric type, select a date range, or choose the currency displayed on the dashboard. In the Compare Dunning screens, you can also configure additional filters to select which campaigns or versions to load for comparison.
Enable multi-currency support
If you're on a Recurly Professional or Elite plan, you can run transactions in more than one currency. Specify which currencies to accept for your account, define pricing for your plans and coupons in the new currency, then choose one of the enabled currencies for the dashboard.
Getting the most from dunning effectiveness
Getting the most from the Dunning Effectiveness section means understanding not just its features, but how to use them to improve your dunning campaigns.
- Key performance indicators (KPIs)
- Recovery rates (for invoices, revenue, and subscriptions)
- Recovery reasons
- For invoice data, check invoice recovery rate and invoice recovery by reason.
- For revenue data, check dunning recovered revenue by recovery reason and dunning lifecycle by day.
- For subscriptions, check saved subscriptions, subscriptions saved by recovery reason, and dunning lifecycle by bucket.
Pay attention to which strategies lead to the highest recovery rates, and watch for strategies that aren't working — indicated by low recovery rates or high churn rates.
- When comparing versions, focus on recovery rate and dunning lifecycle by day.
- When comparing campaigns, look at the same metrics across different campaigns.
Compare the performance of each campaign or version by recovery rate and by when in the dunning lifecycle recovery happens.
Updated 2 months ago