
Accounts analysis
Learn how to use Recurly's Accounts dashboard to track account counts and trends across new, returning, and closed accounts.
Prerequisites
- Users must have Analytics user role permission.
Definition
Key details
Account trends
This chart lets you evaluate the net change in your accounts over time and see how new, existing, and closed accounts each contribute to that change. Use it to spot significant trends or patterns that can inform your strategic decisions.
The chart shows the number of open accounts over time, broken down into three categories:
- Previously existing accounts: Accounts created before the selected timeframe.
- New accounts: Accounts created during the selected timeframe.
- Closed accounts: Accounts closed during the selected timeframe.
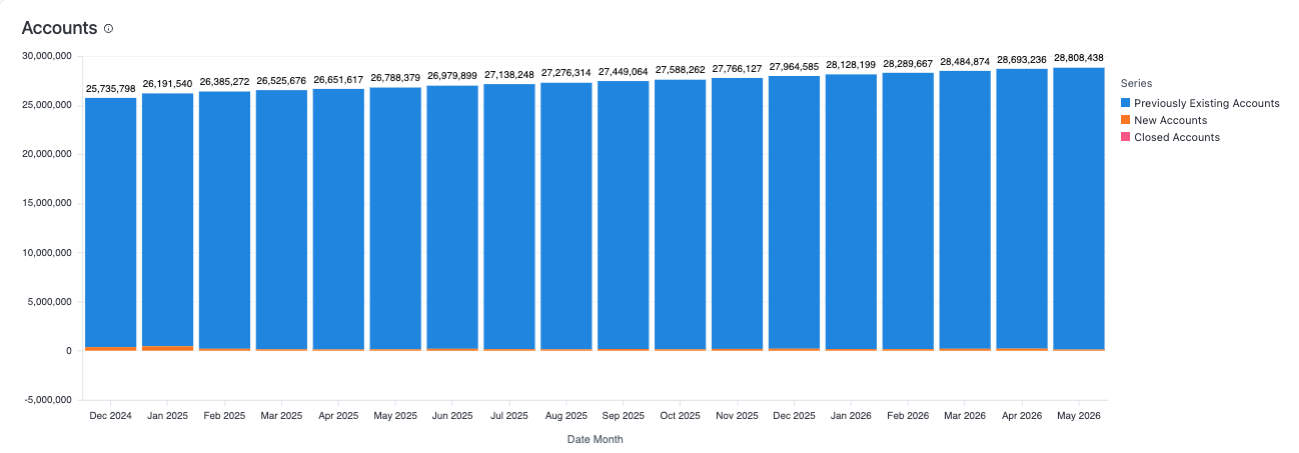
The number above each bar shows the total open accounts for that timeframe. Hover over any point on the bar to see the account count for that timeframe, or select a bar to drill into the specific accounts it represents.
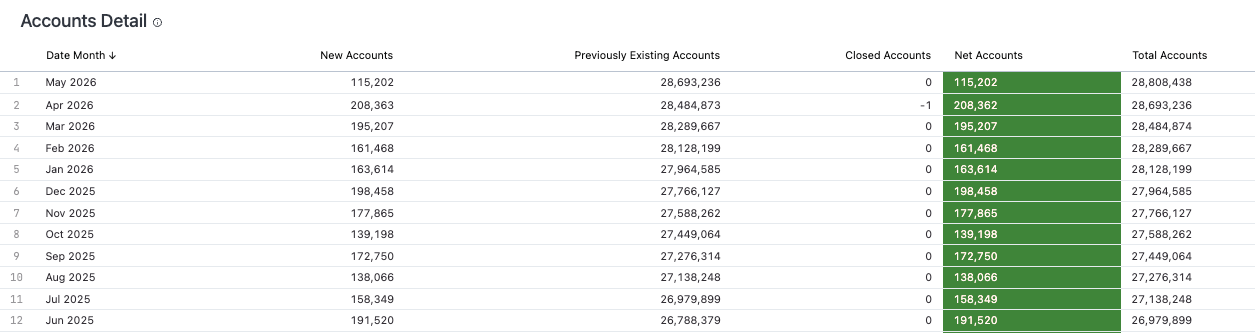
The table below the chart mirrors this data, showing the exact numbers for each timeframe and account group, along with the net and total account counts.
Updated 2 months ago