
Subscriber benchmarks
Learn how the Subscriber Benchmarks dashboard compares your acquisition, signup decline, and churn rates against industry benchmarks.
Prerequisites
- Users must have the Analytics user role permission.
Definition
Key benefits
Key details
General filters (top left corner)
- Date range: Adjust the monthly period for benchmark comparisons. The default is 14 months, letting you track and analyze long-term trends.
- Benchmarks industry: See benchmark data specific to your industry for relevant insights and comparisons.
- Subscriber type: Fixed to "Paying Subscribers," focusing the benchmark comparison on subscribers with at least one paid invoice.
Subscriber benchmarks
The Subscriber Benchmarks dashboard helps you understand how effective your strategies are throughout the subscription lifecycle. By examining your acquisition rate, signup decline rate, and churn rate, you get a full picture of what's working and what needs improvement.
Acquisition rate
The acquisition rate is calculated by dividing the number of subscribers gained during a certain period by the number of subscribers at the start of that period.
- Eligibility: Only includes subscribers who have a paid invoice with an amount greater than zero, excluding those in trial or undergoing dunning from trial.
- Detailed calculation: To be considered an acquisition in a given month, the subscriber must either have only expired subscriptions at the beginning of the month, or no subscriptions at all, and also have at least one non-expired subscription at the end of the month (for example, the subscription state could be active, canceled, or paused). Future, pending, and failed subscriptions aren't included. Because benchmarks are calculated on a monthly basis, this omits any subscribers acquired intra-month who were also present at the beginning of the month, referred to as "ghost acquisition."
- Benchmark calculation: Benchmark quartiles are generated monthly, providing a consistent framework for comparison at the start of each new month. Individual merchant KPI rates, such as the renewal invoice paid rate, are calculated daily — so while the benchmarks themselves update monthly, the underlying data for specific KPIs refreshes throughout the day and can be observed on their respective dashboards. Even with these daily updates, the broader benchmark comparisons remain static throughout the month until the next monthly update cycle.
Example: Assume a subscriber is active on January 1, 2024 and in dunning, then expires or churns on January 10th, and signs back up on January 15th while remaining active through the end of the month. This subscriber won't count as an acquisition, since they were active at the beginning of the month, despite churning and signing up again within the month.
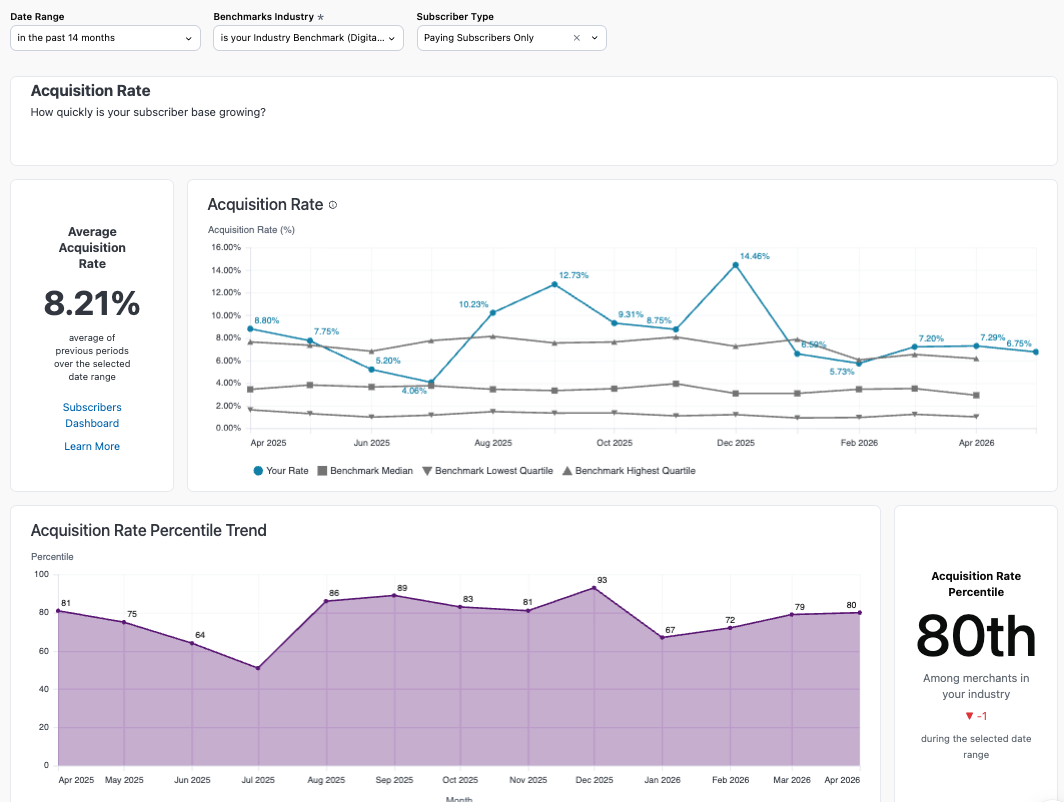
Your ranking within your industry is shown as a percentile, letting you track how your acquisition rate compares to peers over time through the trend of your percentile ranking.
Signup decline rate
The signup decline rate is calculated by dividing the number of unsuccessful initial transaction attempts on an account by the total number of initial transaction attempts on an account.
- Failed signup definition: An account is considered to have a failed signup if its initial attempt to sign up doesn't succeed. Even if the account makes subsequent attempts and eventually succeeds, it's still marked as a failed signup due to the initial failure.
- Inclusion criteria: The calculation includes all kinds of initial transactions, such as authorization or verification transactions, one-time purchases, and subscription signup attempts.
- Example calculation: If five accounts try to sign up, and three succeed on the first try, one fails initially but succeeds later, and one fails and never succeeds, the decline rate is 40%. That's because two out of the five initial signup attempts were unsuccessful.
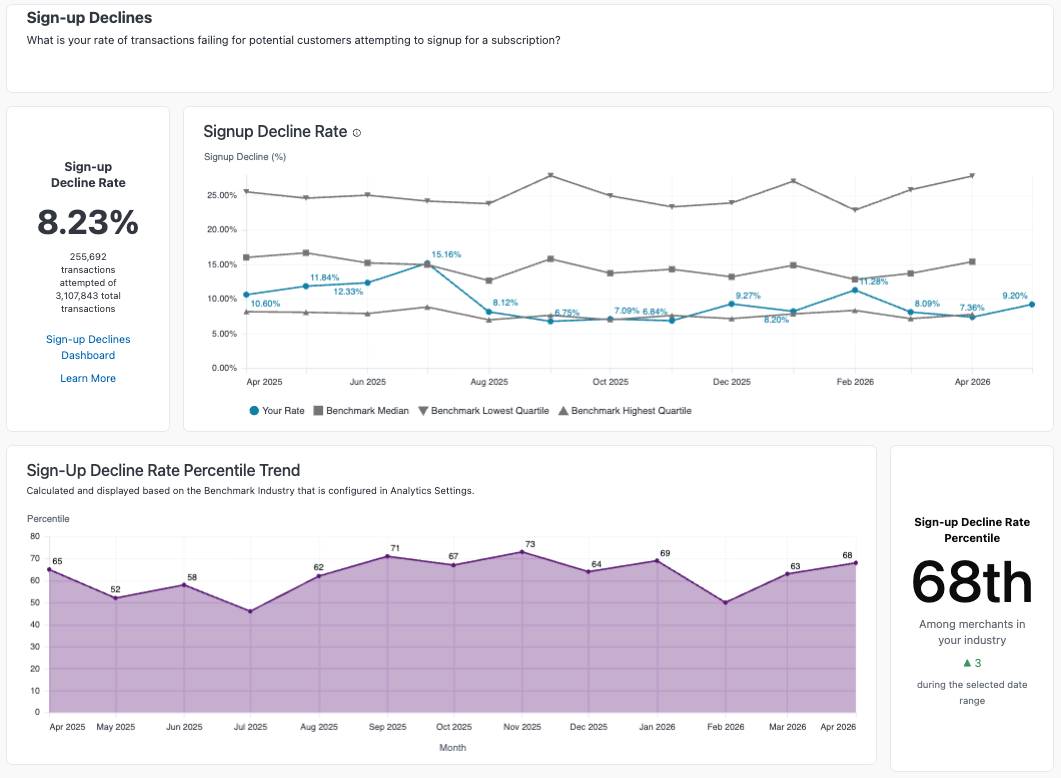
Your performance in this area is displayed as a percentile, showing how you rank compared to others in your industry. Monitoring your percentile trend over time can show you how your signup process compares to industry standards and highlight areas for improvement.
Churn rate
The churn rate metric shows the proportion of subscribers lost during a specified time period, compared to the total number of subscribers at the beginning of that period.
- Subscriber eligibility: Only includes subscribers who have had at least one paid subscription invoice. Subscribers in trial periods, or in dunning following a trial, aren't considered.
- Detailed calculation: Churn benchmarks are calculated on a monthly basis. To be considered churned in a given month, the subscriber must have a non-expired subscription at the beginning of the month (for example, the subscription state could be active, canceled, or paused) and only expired subscriptions at the end of the month. Future, pending, and failed subscriptions aren't considered. Churn that occurs within the month, often referred to as "ghost churn," isn't included in the benchmarks.
- Benchmark calculation: Benchmarks are calculated at the end of each month, with a new benchmark ranking and percentile available at the start of each month.
- Multiple subscriptions: For subscribers with several subscriptions, the last expired subscription is used to categorize the churn as either voluntary (the subscriber chose to leave) or involuntary (due to issues like payment failure).
Example of ghost churn: A subscriber isn't active at the beginning of the month, signs up for a subscription mid-month, then expires before the end of the month. This is not churn, since the subscriber wasn't active at the beginning of the month.
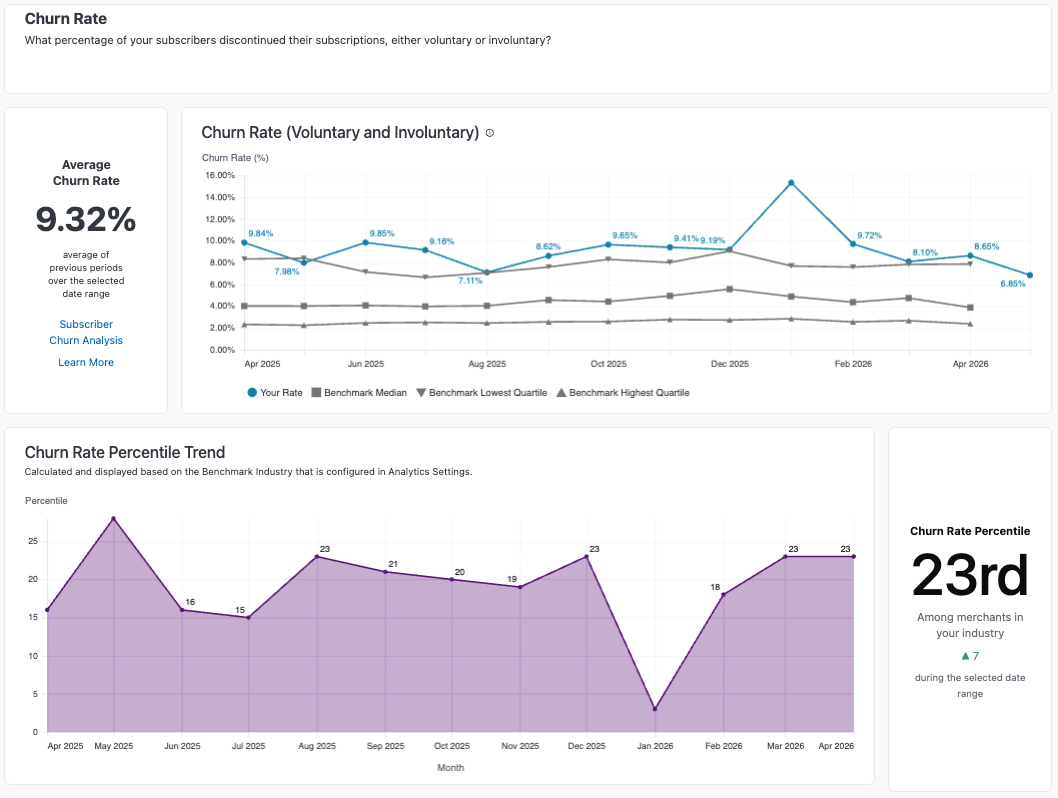
Your performance is represented as a percentile, showing how your churn rate compares to others in your industry. Watching the trend of your percentile over time can reveal valuable insights into the effectiveness of your retention strategies and how they stack up against industry norms.
About benchmarks
Recurly's benchmark reports show how your performance metrics compare to similar businesses in your industry over time. This helps you understand your competitive position and identify growth opportunities by comparing your key performance indicators (KPIs) with industry standards.
FAQs
What is a "Paid Subscriber"?
A "Paid Subscriber" refers to a subscriber who has paid for at least one invoice associated with their subscription. This excludes those currently in a trial period or in a dunning process following a trial.
Why is the timeframe preset to "Monthly"?
Benchmarks are compiled and analyzed monthly to ensure uniform data aggregation and calculation, providing clear and comparable metrics consistently across different periods.
Updated 2 months ago