HomeProduct DocsAPI ReferenceChangelog
RecurlyAPI GuidesRecurly.jsWebhooksAPI ReferenceSupportBook demo
Product Docs

Subscribers (Legacy)

Dive deep into Recurly's Subscribers analytics for a comprehensive view of subscriber behaviors, trends, and growth patterns.

The Subscribers (Legacy) dashboard in Recurly's Reporting & Analytics gives you a detailed view of subscriber counts, growth, and churn using the combine-subscriptions logic from Recurly's earlier analytics experience. Pair the Active Subscribers and Subscriber Growth tables to understand how your subscriber base is changing, and drill down into the specific accounts behind any number on the page.
Available on all Recurly plans

Prerequisites

  • Users must have Analytics user role permission.

Definition

The Subscribers (Legacy) dashboard offers reports and metrics for tracking and analyzing subscriber counts and trends, including subscription signups, churn rates, and overall subscriber growth. Use it to understand subscriber patterns and behaviors so you can make decisions based on actionable data.
NoteIt's important to understand the distinction between a subscriber and a subscription. A single subscriber might hold multiple active subscriptions, but this dashboard counts each individual subscriber — not the number of subscriptions they hold. For more on navigating and using the filter tools, see our analytics overview documentation.

Key details

Using the subscribers dashboard

To get the most out of the Subscribers (Legacy) dashboard, follow these steps:

1

Navigate to Subscriber management

Go to the Subscriber management section in the Reporting & Analytics menu for an overview of subscriber-related metrics and reports.

2

Open the Subscribers dashboard

Within that menu, select the Subscribers dashboard.

3

Turn on Combine Subscriptions

Use the Combine Subscriptions setting, which is on by default, and set the interval that works for you. With it enabled, a subscription that starts immediately after a previous one expires is counted as a single continuous subscription — giving you a more accurate picture of activations and churn.

How subscriptions get combined depends on the gap you select in the Combine Subscriptions setting. Adjust this gap to combine subscriptions further.

4

Review the Active Subscribers table

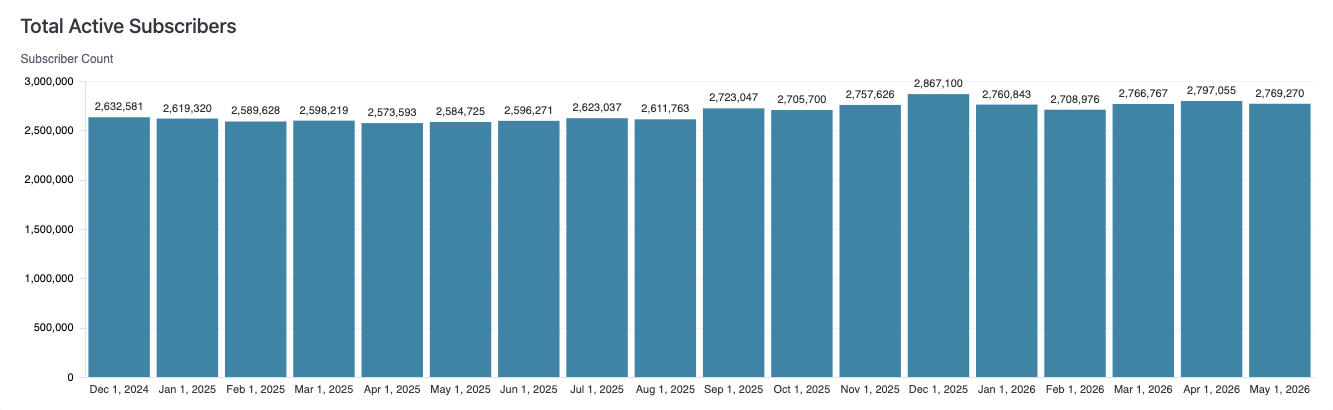
This table shows the total number of active subscribers on your platform, helping you understand the growth and composition of your subscriber base. Pair it with the Subscriber Growth table to see the breakdown of that growth — compare activated subscribers against churned subscribers to determine your net count and spot trends.
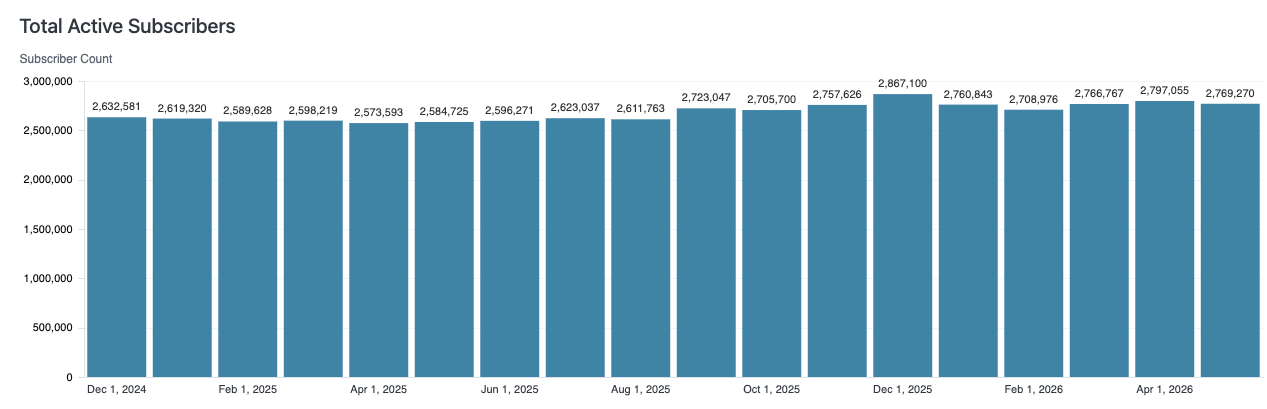
Select any bar to drill down into the specific accounts that make it up.
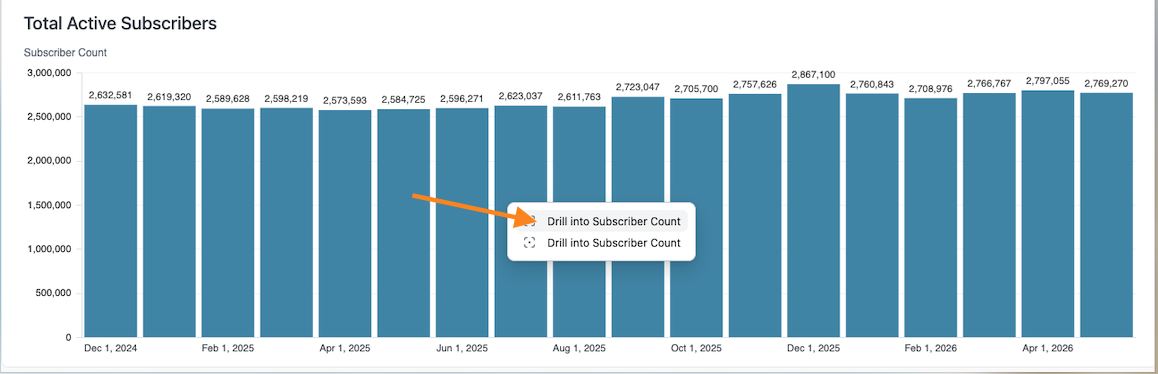
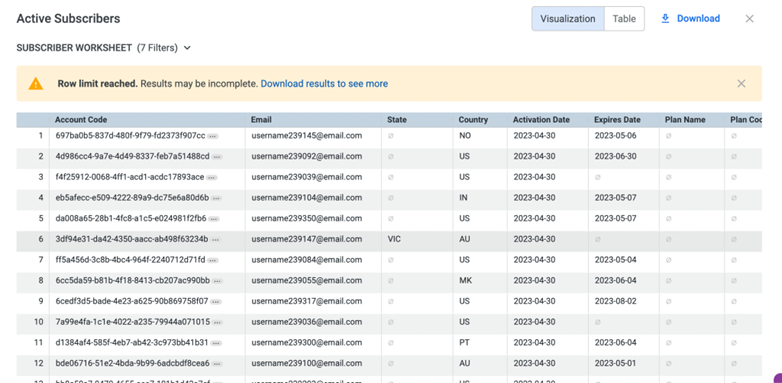
Each field gives you specific information about the account, its status, and its subscription details — useful for tracking and managing customer accounts efficiently.

5

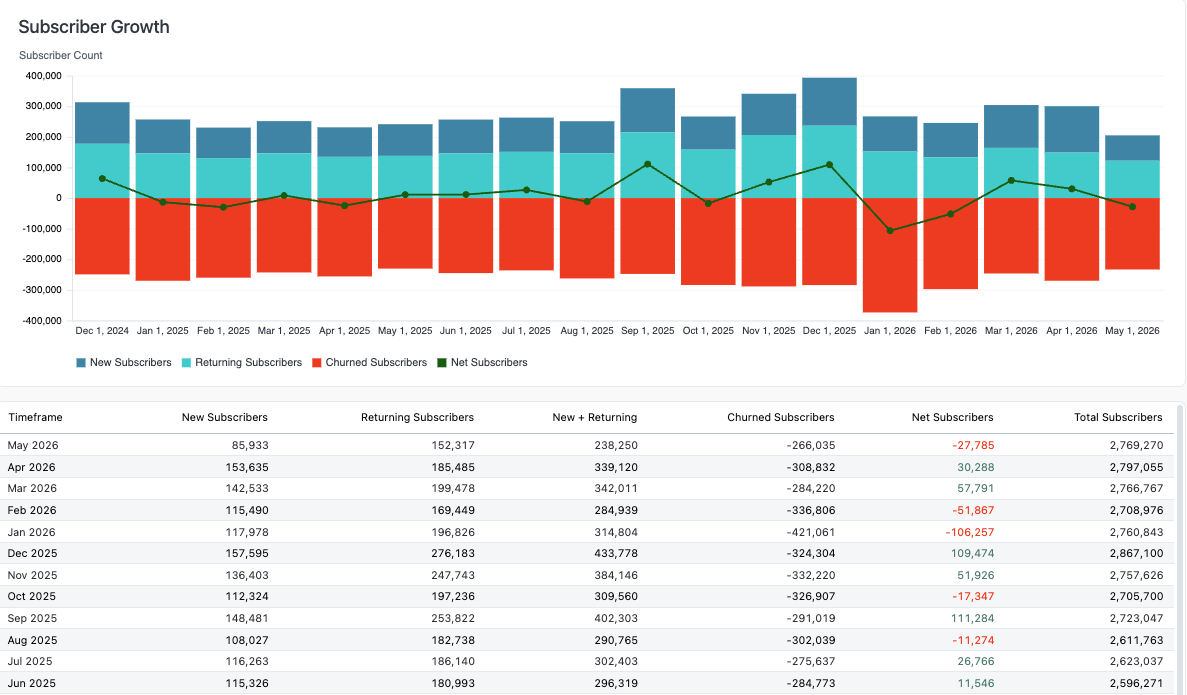
Explore the Subscriber Growth section

This section closely mirrors the default Subscriber Growth section, with two key differences:

  1. The New and Returning categories are merged into a single group labeled Activated Subscribers.
  2. Every bar and number is clickable, revealing a breakdown of the specific accounts behind each figure.
6

Use filters and drill-downs

Use the interactive filters and data drill-downs to explore specific aspects of subscriber metrics within the worksheet, and tailor the analysis to your needs.


Did this page help you?