Trial performance
Unlock insights with the 'Trial Performance' dashboard: A real-time tool to monitor subscription trial outcomes and conversion rates, updated frequently for the latest data.
Overview
Required plan
This feature or setting is available to all customers on any Recurly subscription plan.
Prerequisites
- Users must have Analytics user role permission.
Definition
The Trial Performance dashboard is a crucial tool that allows you to track the performance of your subscription trials and monitor the conversion rates from trial to active subscriptions. This dashboard is updated several times daily to ensure access to the most current information. The last update time can be verified by checking the widget at the bottom of the dashboard.
Note: It's essential to note the distinction between a subscriber and a subscription. While a single subscriber might hold multiple active subscriptions, this dashboard focuses on counting the individual subscriber, not the number of subscriptions they possess.
For additional guidance on navigating and utilizing filter tools, consult our documentationhere.
Trial performance dashboards
The Trial Performance Dashboard is structured into several sections, each providing specific insights about your trials. These sections include.
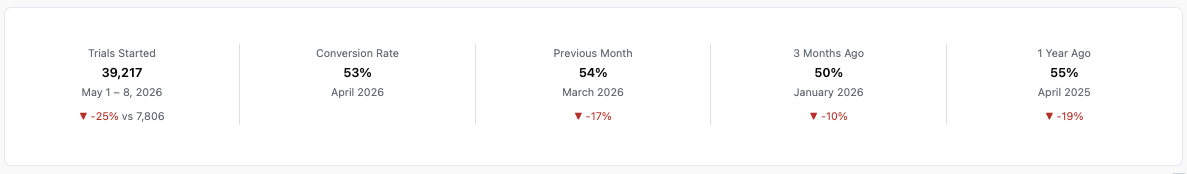
Trial performance key performance indicator (KPI) totals
This widget provides an at-a-glance view of your trial performance. It displays the current Trials Started totals, as well as totals for last month, the previous month, three months ago, and one year ago. An up arrow under each total indicates the difference between that timeframe and the Total Started value, providing a quick visual representation of the growth or decline of your trials over time.
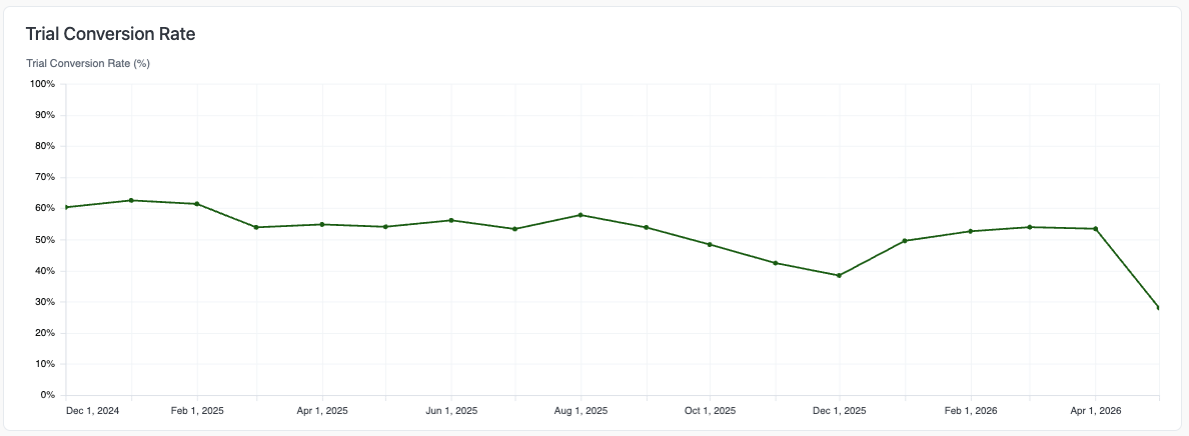
Trial conversion rate
This section features a line chart that shows the conversion rate for trial subscriptions that transitioned to paid subscriptions during the selected date range. It's important to note that "converted" means the subscription moved from a free trial to a paid subscription, either automatically or manually. However, setup fees charged while the customer is in trial aren't included in this conversion metric. Also, this dashboard doesn't track the state of the subscription after conversion. The date range and interval picker impact the date the subscription started in trial.
Trial subscription status
This bar chart tracks the current state of subscriptions that began as trials during the selected date range. Only subscriptions that started with a trial are included in this chart.
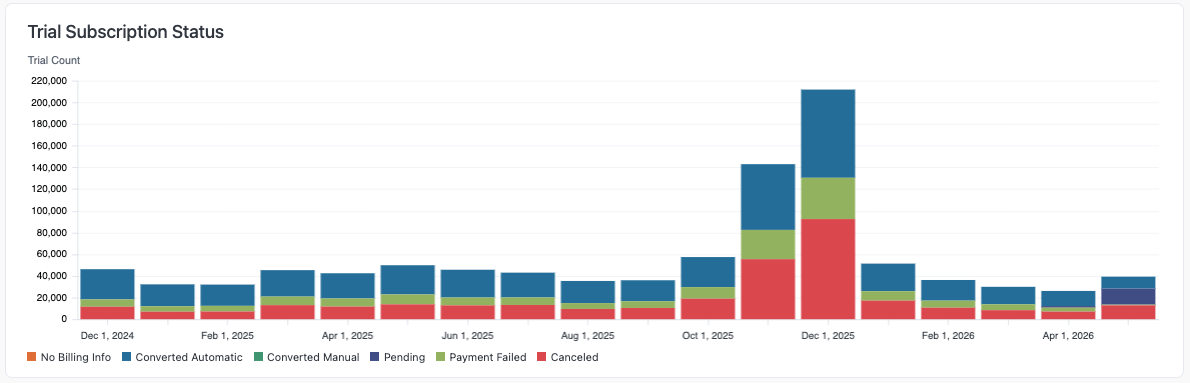
The potential states for these subscriptions are:
- Canceled: The subscription was canceled.
- Payment Failed: Customer entered billing information, and the trial churned after failing to collect payment.
- Pending: A temporary state of subscriptions that started in trial and have not yet converted or churned.
- Converted Manual: The subscription, where manual invoices/payment collection is enabled, ended trial and successfully converted to paid (through a manual payment greater than 0).
- Converted Auto: The subscription ended its trial and the invoice of greater than 0 is successfully converted to paid , where automatic invoices/payment collection is enabled.
- No Billing Info: The customer never entered billing information.
Trial subscription status details
This section provides more granular detail on the status of trial subscriptions for a selected date range.
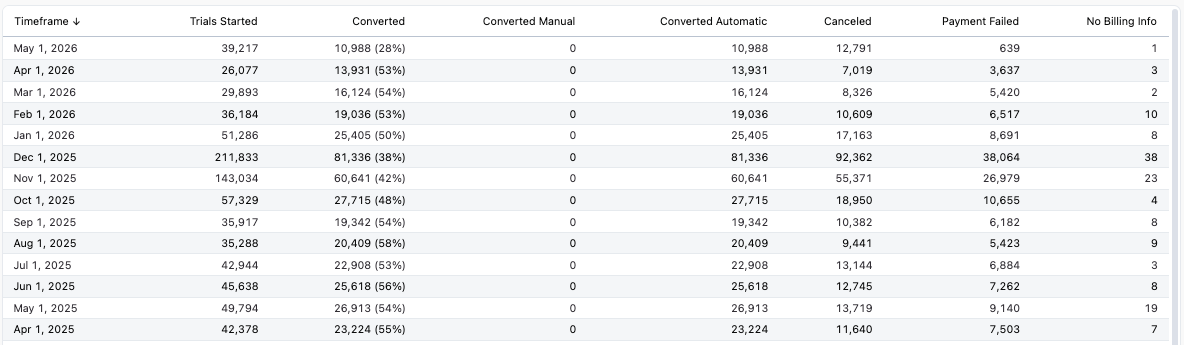
It tracks the following metrics:
- Trials started
- Converted (Sum of Converted - Auto and Converted - Manual)
- Converted - Automatic
- Converted - Manual
- Canceled
- Payment Failed
- Pending
In summary, the Trial Performance Dashboard provides a comprehensive view of your trials, helping you understand your trial performance and make data-driven decisions to optimize your trial conversion rates.
Viewing trial performance key performance indicator (KPI) totals
- From your Recurly dashboard, navigate to the "Trial Performance" dashboard.
- Locate the "Trial Performance KPI Totals" widget.
- You can view the number of trials started for the current month, last month, the previous month, three months ago, and one year ago.
- The arrow indicator below each total displays the difference between that specific time frame and the total number of trials started.
Analyzing the trial conversion rate
- In the "Trial Performance" dashboard, find the "Trial Conversion Rate" line chart.
- This chart displays the conversion rate for trial subscriptions that converted to paid subscriptions during the selected date range.
- Review the line chart to track conversion trends and patterns over time.
Assessing the trial subscription status
- On the "Trial Performance" dashboard, identify the "Trial Subscription Status" bar chart.
- This chart shows the current state of subscriptions that started as trials during the selected date range.
- Examine the bar chart to determine how many trial subscriptions have converted (either manually or automatically), have been canceled, have failed payment, or are still pending.
Monitoring the trial subscription status details
- Navigate to the "Trial Subscription Status Details" section on the "Trial Performance" dashboard.
- This section provides a more granular view of the status of trial subscriptions over a selected date range.
- Use this information to further analyze the effectiveness of your trials and to identify potential issues or areas of improvement.
Updated about 2 months ago