Subscriber retention
Unlock powerful insights with Recurly's Subscriber Retention feature. Dive deep into retention & churn trends, leverage cohort analysis, and strategize effectively to boost customer loyalty.
Overview
Required plan
This feature or setting is available to all customers on any Recurly subscription plan.
Prerequisites
- Users must have Analytics user role permission.
Definition
Subscriber Retention is a powerful feature within Recurly that allows businesses to analyze and evaluate the retention and churn rates of their paid subscribers over a specified timeframe. By utilizing cohort analysis, the Subscriber Retention dashboard provides insights into the performance and trends of subscriber retention, enabling businesses to identify areas for improvement and develop effective strategies to maximize customer retention.
Note: It's essential to note the distinction between a subscriber and a subscription. While a single subscriber might hold multiple active subscriptions, this dashboard focuses on counting the individual subscriber, not the number of subscriptions they possess.
For additional guidance on navigating and utilizing filter tools, consult our documentationhere.
By setting the appropriate interval, subscriptions that start immediately after the expiration of a previous subscription will be counted as a single continuous subscription. This helps provide a more accurate representation of activations and churn.
Subscriber retention dashboards
This section presents insights into the retention trends of subscribers through a Subscriber Cohort Descent line chart and detailed cohort analysis.
- The sign-up month denotes the month in which a new subscriber has made a payment exceeding $0. Subscribers with a $0 invoice or whose first paid invoice is overdue will not be considered. Thus, to be categorized in the "Paying Subscriber" cohort, a subscriber must have successfully settled their invoice.
- Data excludes subscriptions under trial or those covered by a previously purchased gift card.
- Subsequent subscriptions purchased by an existing subscriber won't affect this dataset.
- A subscriber is regarded as retained if they have at least one active subscription. On the flip side, they're deemed to have churned if their sole or last subscription lapses. A subscription on hold is not labeled as churned.
- Subscribers are counted in month 0 retention if they stay subscribed for a full month post-sign-up. As an instance, a subscriber joining on November 14th but leaving before December 14th is logged as a churn in Month 0. Similarly, one who exits before January 14th is registered as a churn in Month 1.
Filters

Subscriber filters
- All Subscribers: Includes all accounts with a current or past active subscription.
- Paying Subscribers Only: Includes subscriptions where at least one successful payment has been made.
- Paying Subscribers Only (Exclude Refunds): Includes subscriptions with successful payments where the total payment amount, after refunds, is greater than $0.
- Non-Paying Subscribers: Includes subscriptions where no successful payments have been made, starting from activation and ending at expiration.
- Trials: Includes subscriptions currently in their trial period.
Metric Types
- Percent (% Still Active): The percentage of subscriptions that remain active.
- Active (# Still Active): The total number of subscriptions still active.
- Churned (# Churned): The total number of subscriptions that have churned.
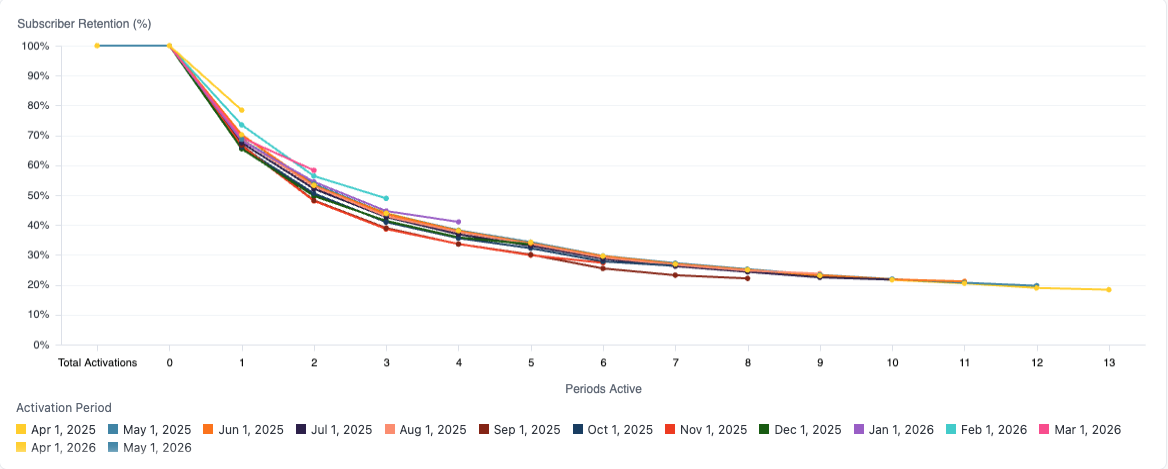
Subscriber Retention
A line chart visualizing the subscriber retention rate based on chosen metrics like percentage, active status, or churn rate, across the specified period.
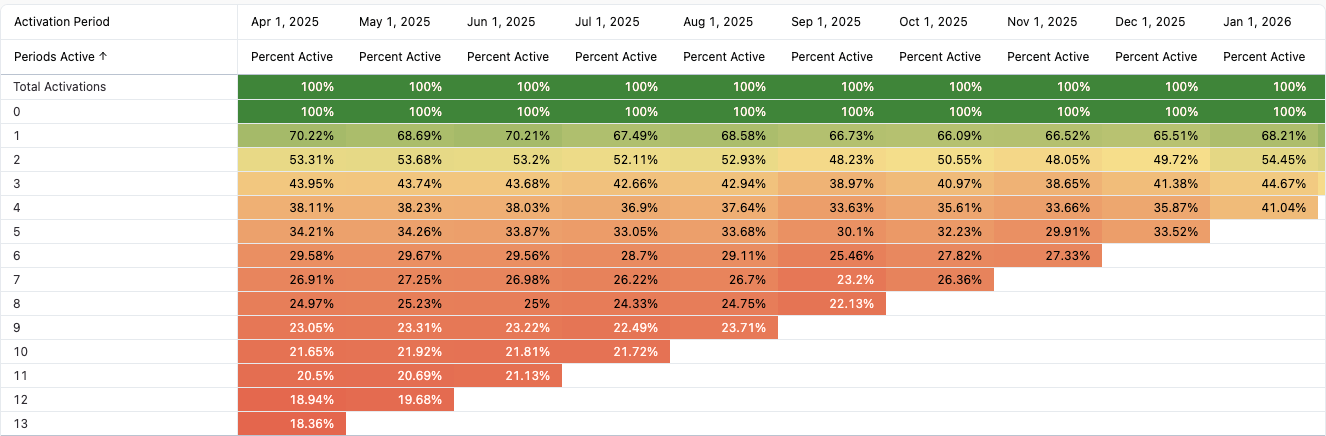
Subscriber retention analysis detail
A deep dive into the retention figures of paying subscribers registered in a specific month. The snapshot below reveals the month-wise percentage of these subscribers. Users can now download data spanning up to 100 columns.

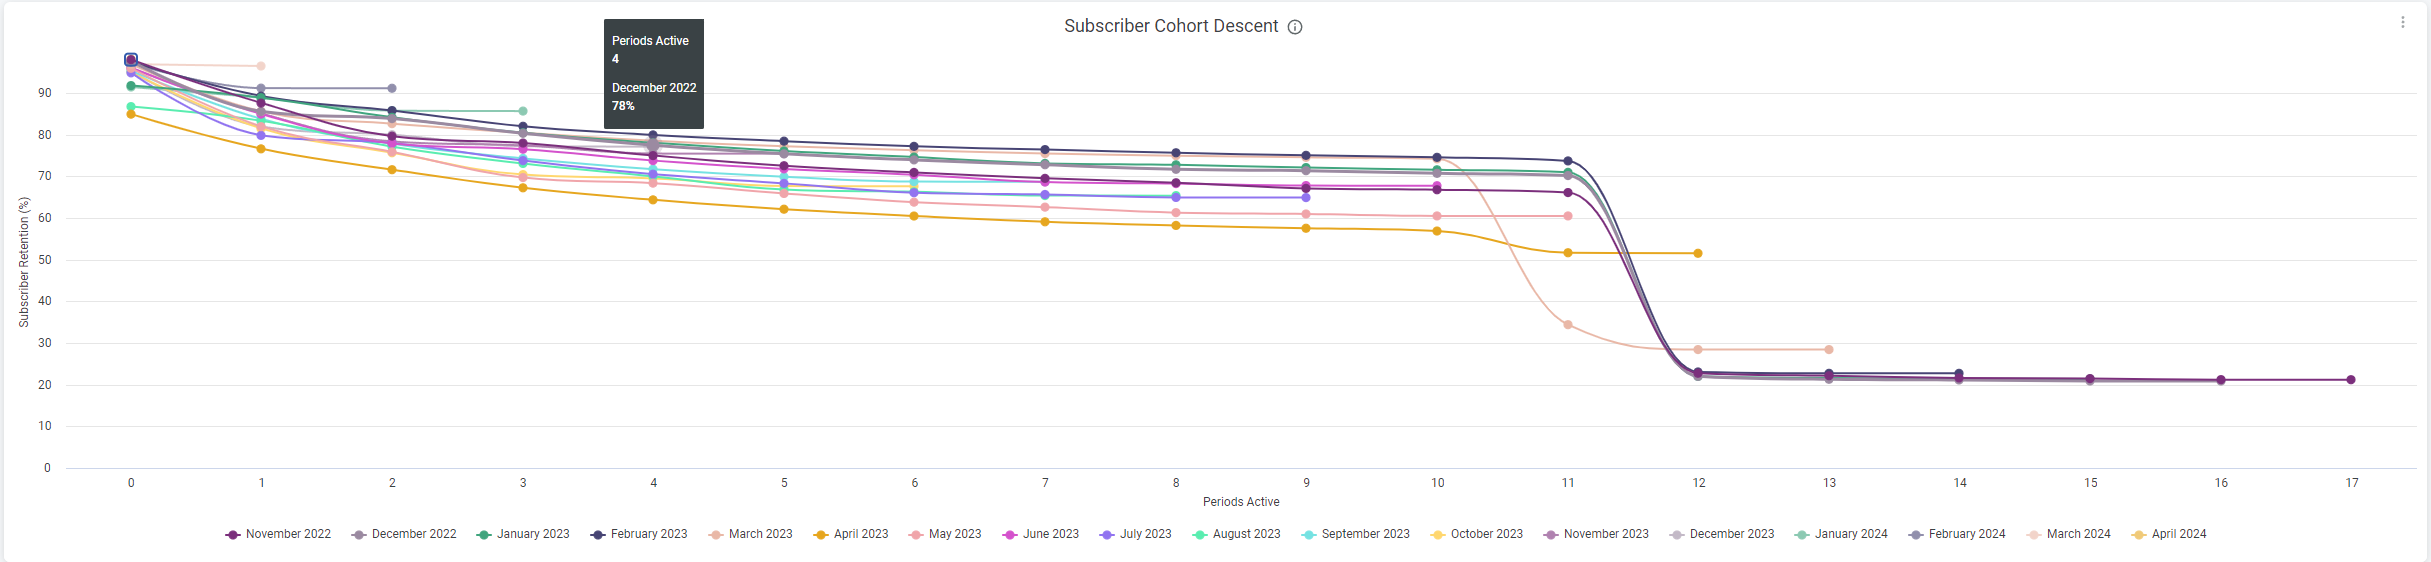
Subscriber Retention Cohort Decent
Cohort Analysis Detail: is a cohort analysis of retention count for paying subscribers that sign up in a designated month. The example in the following screenshot shows the percentage of paying subscribers by month. You can download this up to 100 columns now.

Subscriber Retention Cohort Analysis Detail
Drill experience
Enhance your data analysis by drilling down into specific points directly from the data charts. This feature allows for a deeper understanding of the underlying metrics.
As part of the drill-down experience, you will encounter detailed data columns, each providing a specific metric:
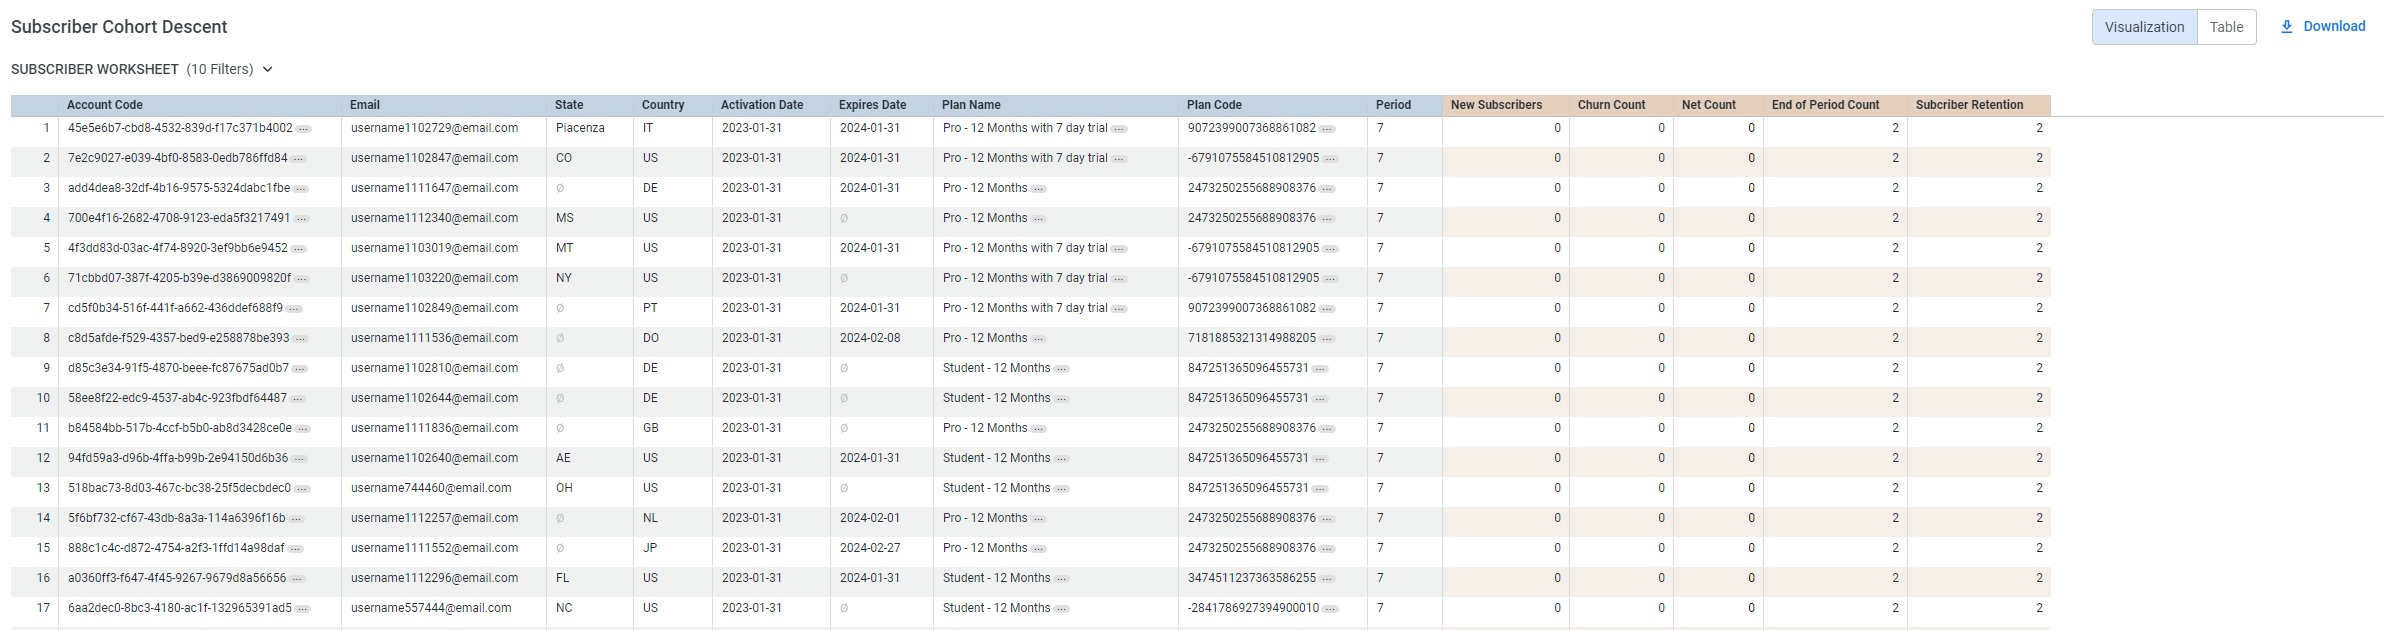
new_subscribers: Represents whether a subscriber is new within the specified period. A value of 1 indicates a new subscriber; otherwise, it's 0.churn_count: Indicates whether a subscriber has churned. A value of 1 signifies a churned subscriber during the analyzed period.net_count: Reflects subscribers contributing to the total count displayed. A value of 1 means the subscriber is included in the net count.End of Period Count: Shows if a subscriber is active at the end of the period. A value of 1 denotes an active subscriber at period end.subscriber_retention: Identifies subscribers retained during the period. A value of 1 is assigned to "retained" subscribers.
Updated about 2 months ago