Subscriber churn benchmarks
Subscriber churn benchmarks allow merchants to see their key performance metrics, related to subscribers, how they stack against similar companies within their industry, and how they’re trending.
Overview
Required plan
This feature or setting is available to all customers on any Recurly subscription plan.
Prerequisites
Users must have analytics user role permission.
Definition
The subscriber churn benchmarks dashboard will provide insights on your churn rates, including overall churn, as well as both involuntary and voluntary , comparing yourself to others in your industry with Recurly’s built-in benchmarks.
Key benefits
-
Industry comparison: Compare key subscription metrics with industry benchmarks to understand performance relative to peers, identifying areas of strengths and weaknesses.
-
Competitive insights: Gain insights into how competitors are faring in terms of subscription metrics, uncovering areas to differentiate and improve to gain a competitive edge.
-
Informed decision-making: Make informed decisions based on real-world data to help set realistic goals and expectations for subscription growth and customer retention.
-
Forecasting and planning: Enable more accurate forecasting and long-term planning to help businesses set reachable growth targets and allocate resources effectively.
Subscription churn (legacy) dashboardThe Subscription Churn (Legacy) dashboard is still available via a link at the bottom of this dashboard. This dashboard provides an insight to churn at the subscription level, rather than the subscriber level. It is recommended to primarily measure churn at the subscriber level for the following reasons:
- Recurly uses subscriber level churn to benchmark merchant performance.
- Subscription level churn can sometimes be inflated if subscriptions are automatically expired and automatically rolled into new subscriptions.
Key Details
General filters (top left corner)
-
Date Range: You can adjust the time period for viewing your benchmark comparisons, with a default setting of 14 months. This allows you to analyze trends over more than a year.
-
Industry: This filter lets you view benchmark data tailored to your specific industry, providing more relevant insights.
-
Subscriber Type: Another non-editable filter, preset to "Paying Subscribers." It focuses your benchmark comparison on those subscribers who have made payments.
Subscriber benchmarks
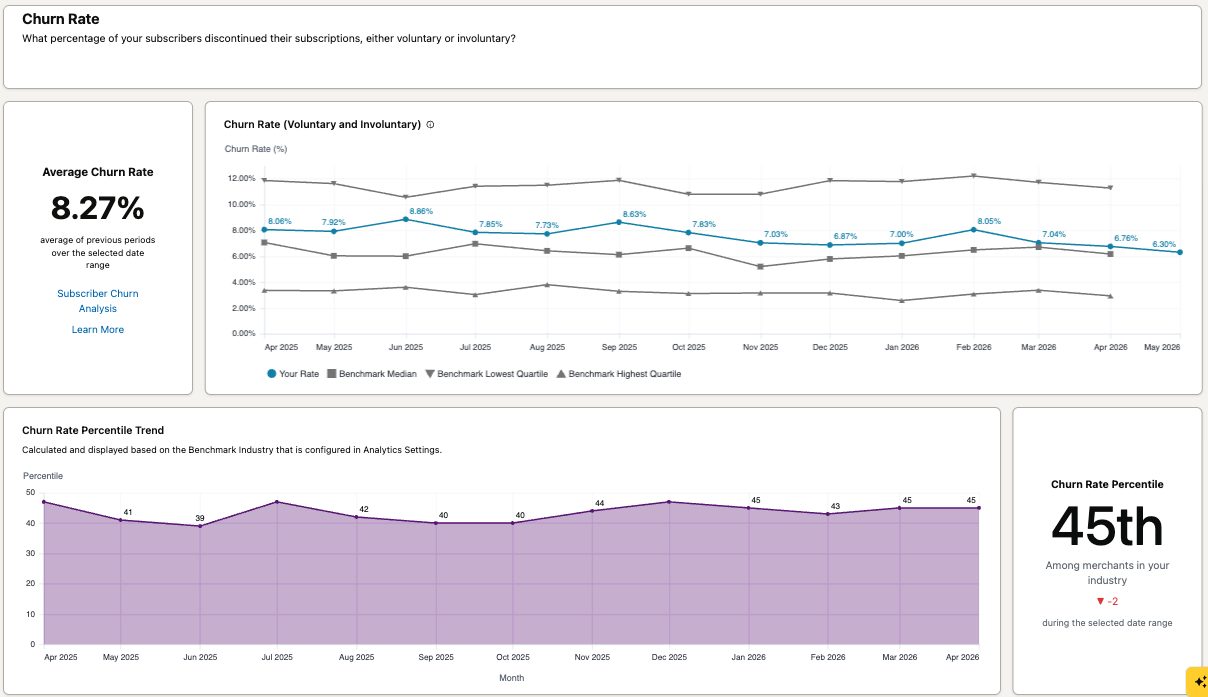
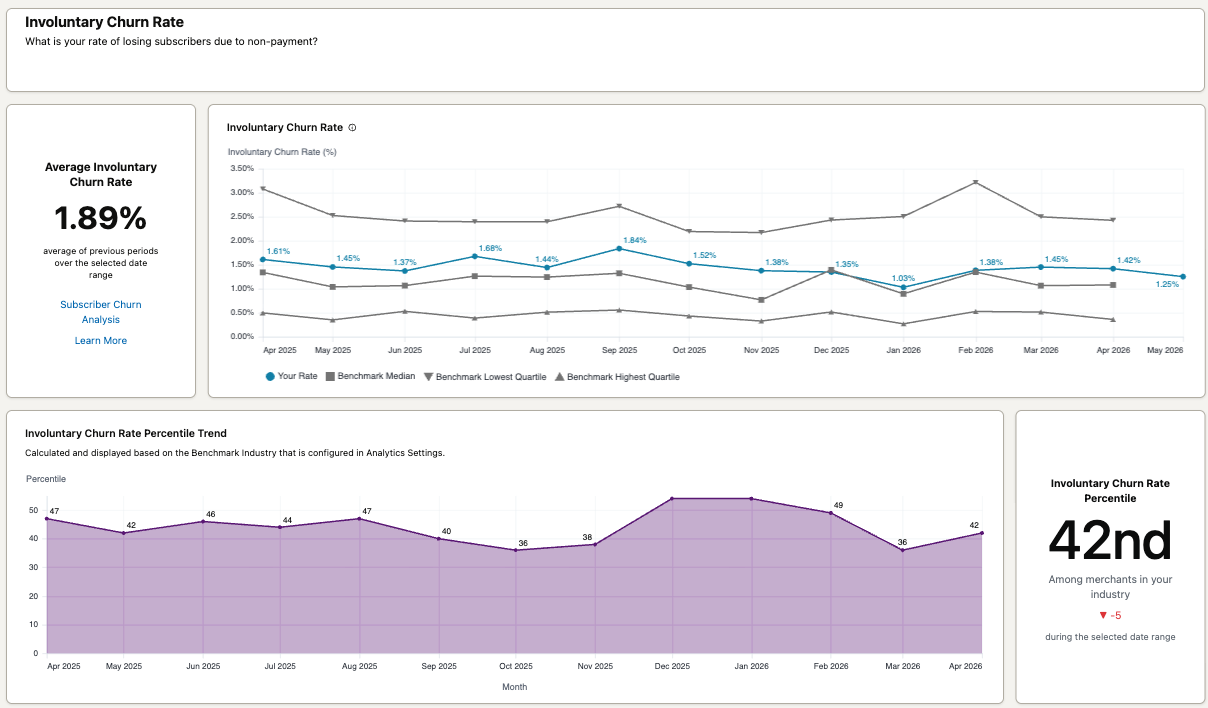
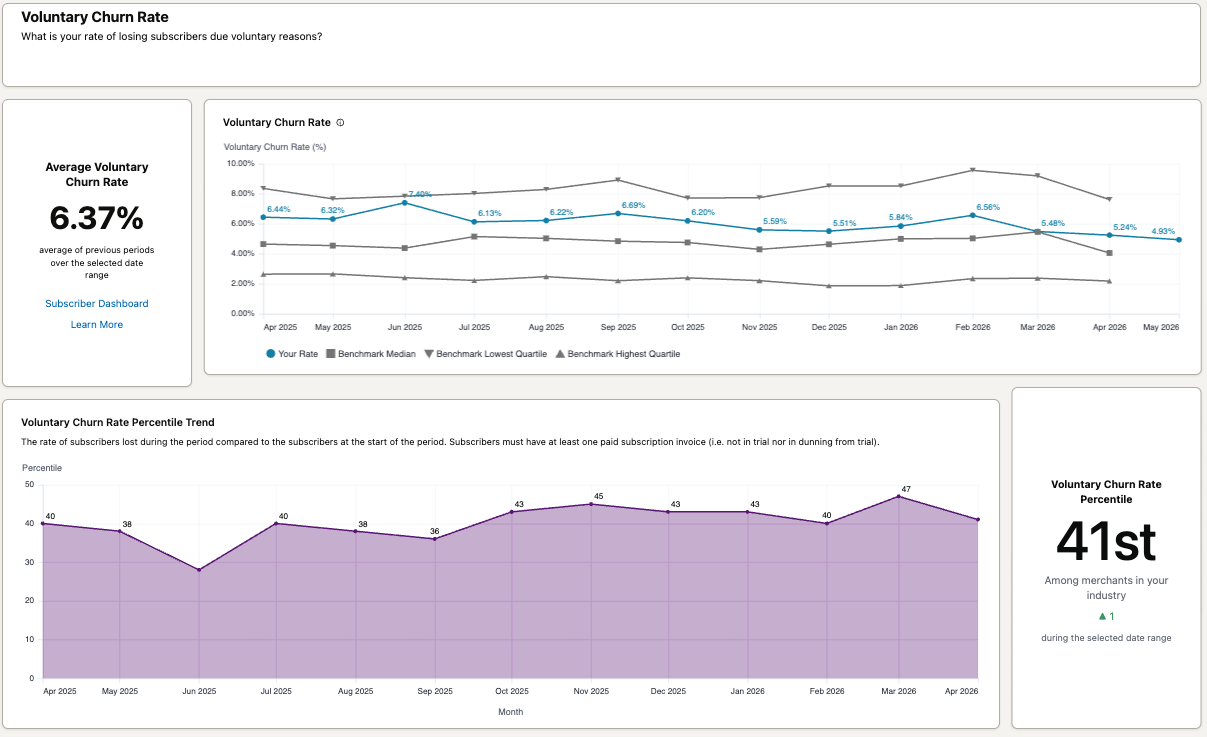
The subscriber churn benchmarks dashboard is a powerful tool for evaluating the success of your customer retention strategies. By presenting your churn rates clearly, it helps you identify both the strengths and weaknesses of your current approach. Understanding these metrics is crucial for refining your tactics and enhancing subscriber retention effectively.
Churn rates
Churn rates are calculated by dividing the number of subscribers lost during a specified time period by the total number of subscribers at the beginning of that period. Here are the key considerations for calculating churn rates:
-
Eligibility Criteria: Only subscribers who have received at least one paid subscription invoice are included. This means subscribers in a trial phase or in a dunning process from a trial are not considered.
-
Detailed Calculation: Benchmarks apply exclusively to monthly periods. Any churn occurring within the month (often referred to as ‘ghost churn’) is not included in the benchmarks.
-
Benchmark Calculation Benchmark quartiles are generated monthly, providing a consistent framework for comparison at the start of each new month. However, individual Merchant KPI rates, such as the renewal invoice paid rate, are calculated on a daily basis. This means that while the benchmarks themselves are updated monthly, the underlying data for specific KPIs is refreshed daily and can be observed on their respective dashboards. It's important for users to note that although these daily updates occur, the broader benchmark comparisons remain static throughout the month until the next monthly update cycle.
-
Multiple Subscriptions: If a subscriber has multiple subscriptions that expire for any reason, the reason for the last subscription expiration is used to classify the churn as either voluntary (chosen by the subscriber) or involuntary (due to non-payment).
Your performance, in terms of churn, is contextualized within your industry by displaying your percentile rank. Observing your percentile trend over time can offer insights into how your churn rate compares to industry standards and whether your retention strategies are becoming more or less effective.
There are three key churn benchmarks to consider:
- Overall Churn: This metric aggregates both involuntary and voluntary churn, providing a comprehensive view of total subscriber loss.
- Involuntary Churn: This benchmark focuses on subscribers lost due to payment issues, helping you understand the effectiveness of your payment recovery efforts.
- Voluntary Churn: This measures the rate at which subscribers choose to leave of their own accord, offering insights into subscriber satisfaction and the value they perceive from your service.
About benchmarks
Recurly's benchmark reports offer insights into your performance metrics compared to similar businesses in your industry over time. This tool helps you understand your competitive position and identify growth opportunities by comparing your key performance indicators (KPIs) with industry standards.
FAQs
What is a "Paid Subscriber"?
A "Paid Subscriber" refers to someone who has at least one paid invoice associated with their subscription. This excludes subscribers who are currently in a trial period or in a dunning process following a trial.
Why is the timeframe preset to "Monthly"?
The benchmarks are compiled and analyzed on a monthly basis to ensure consistency and accuracy in the data. This approach allows for a standardized comparison of performance metrics across different periods and companies.
Updated 2 months ago