MRR by plan
Dive deep into the heart of your revenue metrics with 'Plan Performance MRR'. Understand and optimize your Monthly Recurring Revenue sources and trends.
Overview
Required plan
This feature or setting is available to all customers on any Recurly subscription plan.
Prerequisites
- Analytics user role permission is required to access this dashboard
Limitations
- Data only includes plans that have had at least one subscriber
- This dashboard counts individual subscribers, not the total number of subscriptions. A subscriber with multiple active subscriptions is counted once
Definition
MRR by Plan is an analytics dashboard in Recurly that breaks down Monthly Recurring Revenue (MRR) by individual plan. It shows total MRR per plan, net MRR impact from subscription changes, and a detailed growth breakout — so you can see exactly what's driving revenue growth or contraction across your subscription catalog.
For guidance on navigation and filter tools, see the Recurly Analytics overview.
Key benefits
- Plan-level revenue visibility: See exactly which plans generate the most MRR and how each one contributes to your overall revenue.
- Net MRR tracking: Understand the net impact of new subscriptions, expansions, reactivations, and churn on your monthly revenue at a glance.
- Growth breakout analysis: Identify the specific factors driving MRR changes — whether that's new acquisition, expansion, or contraction — to inform pricing and retention decisions.
Key details
Dashboard overview
The MRR by Plan dashboard is organized into two sections:
- Monthly Recurring Revenue — contains the MRR Totals line chart and the Net MRR bar chart
- MRR Growth Breakout — contains five bar charts tracking individual MRR change categories
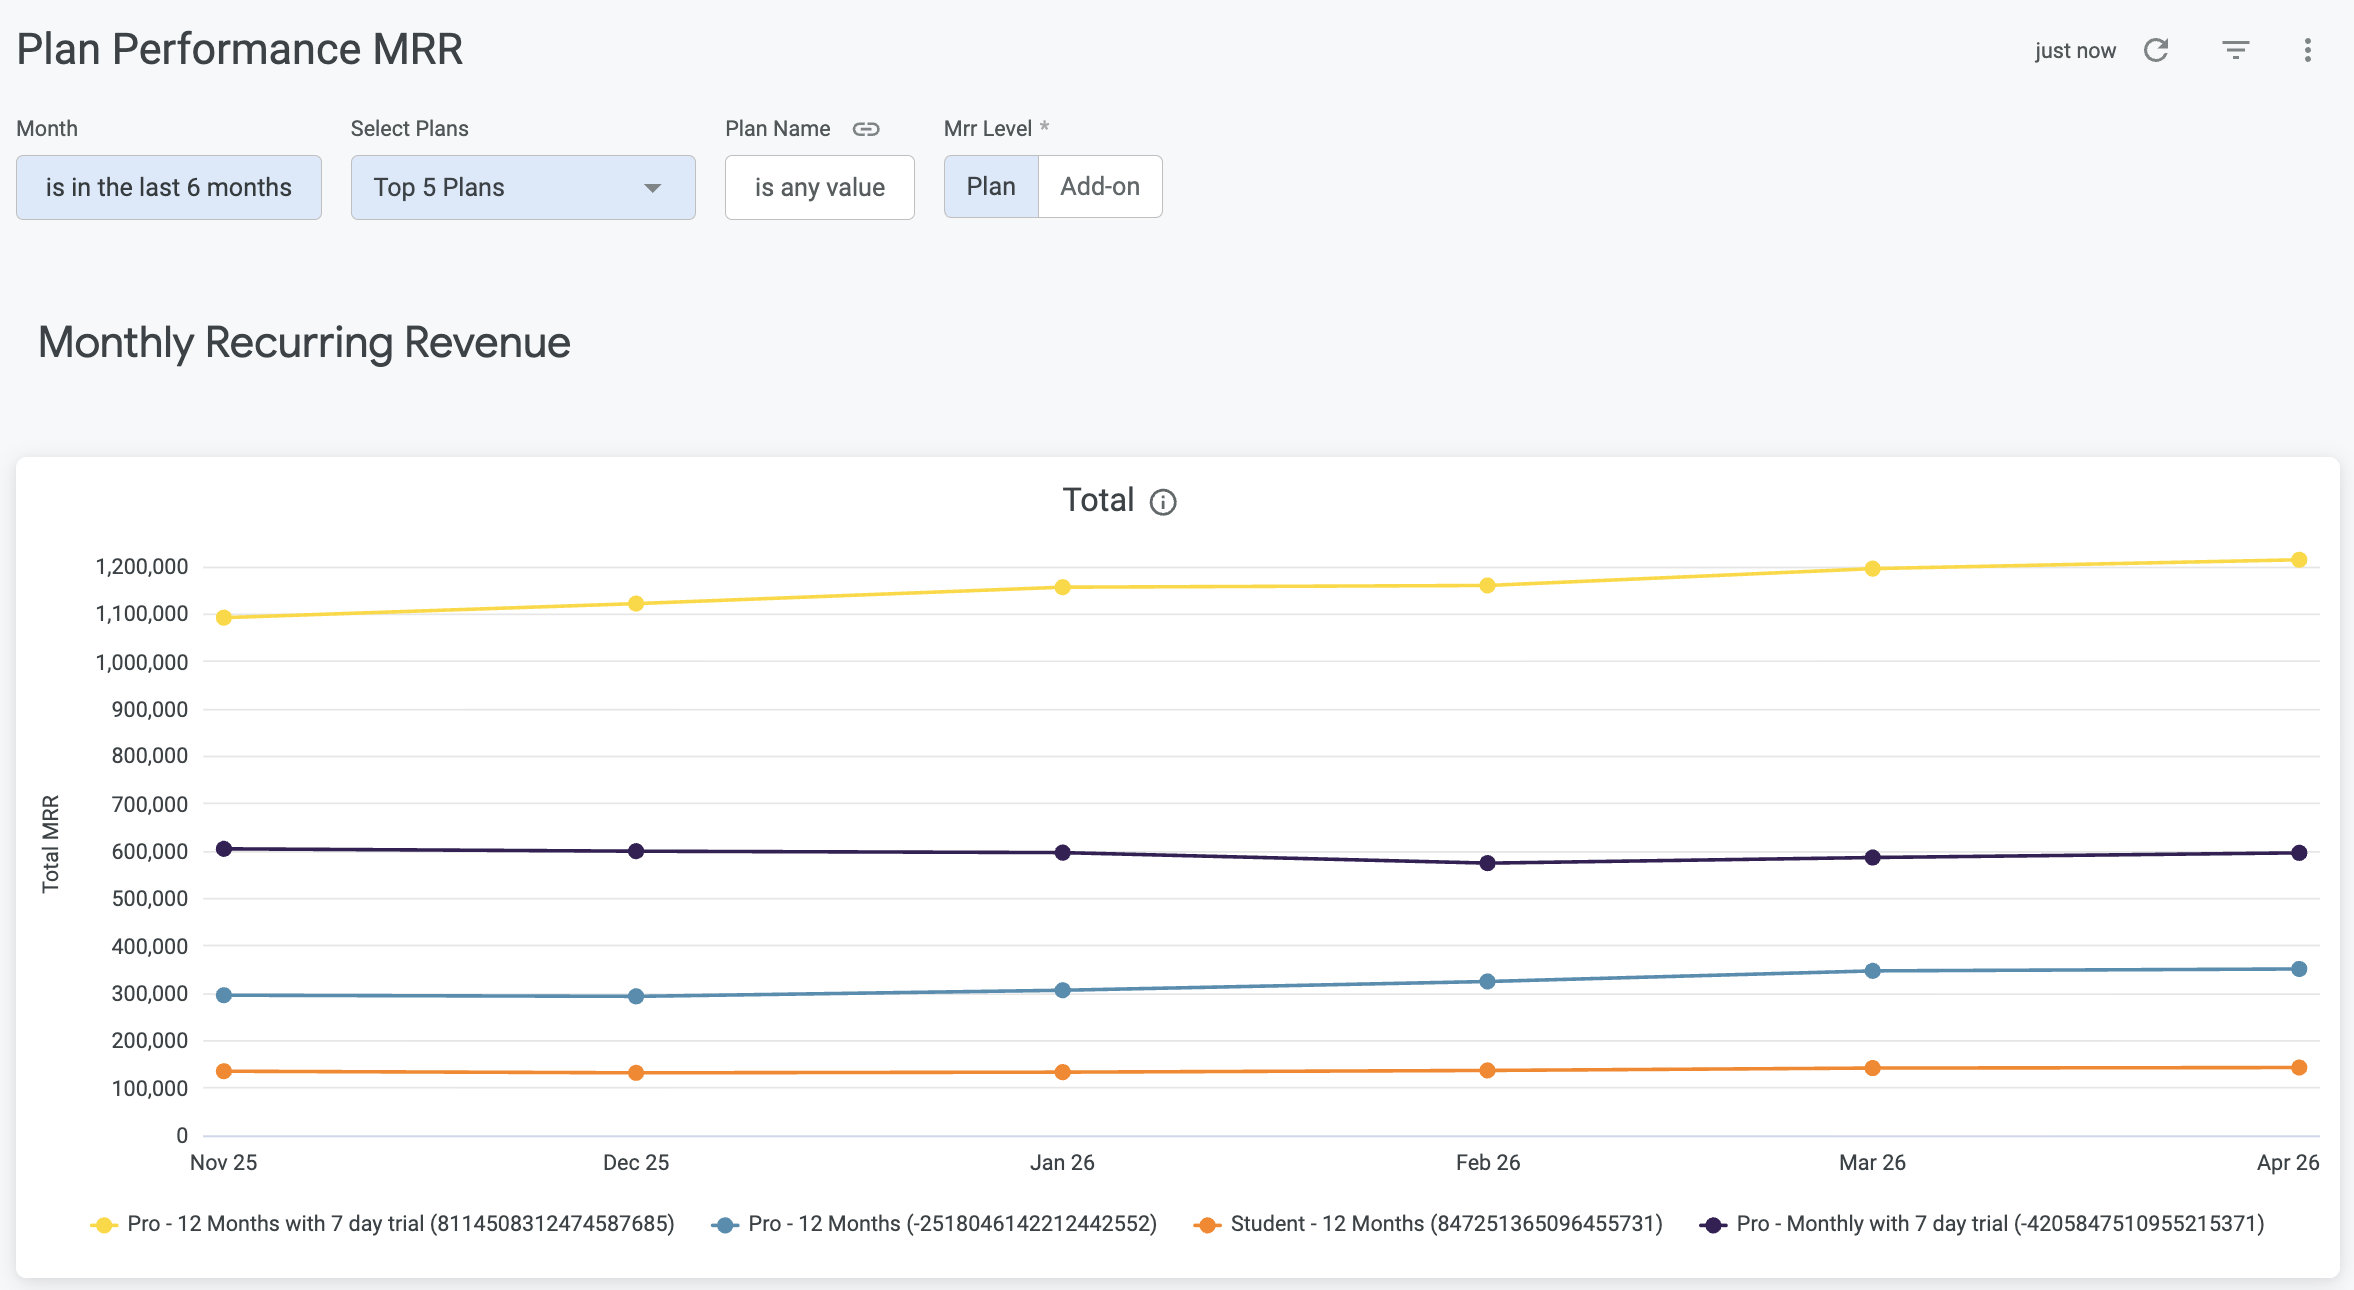
At the top of the dashboard, you can adjust the view grain to show MRR at the plan level or include add-on revenue:
- Plan — shows MRR for the plan only
- Add-on — shows MRR for the plan plus its add-ons

Monthly recurring revenue charts
MRR totals
The MRR Totals line chart shows the MRR contributed by subscriptions for each plan over time, making it easy to compare plan performance and spot top earners.
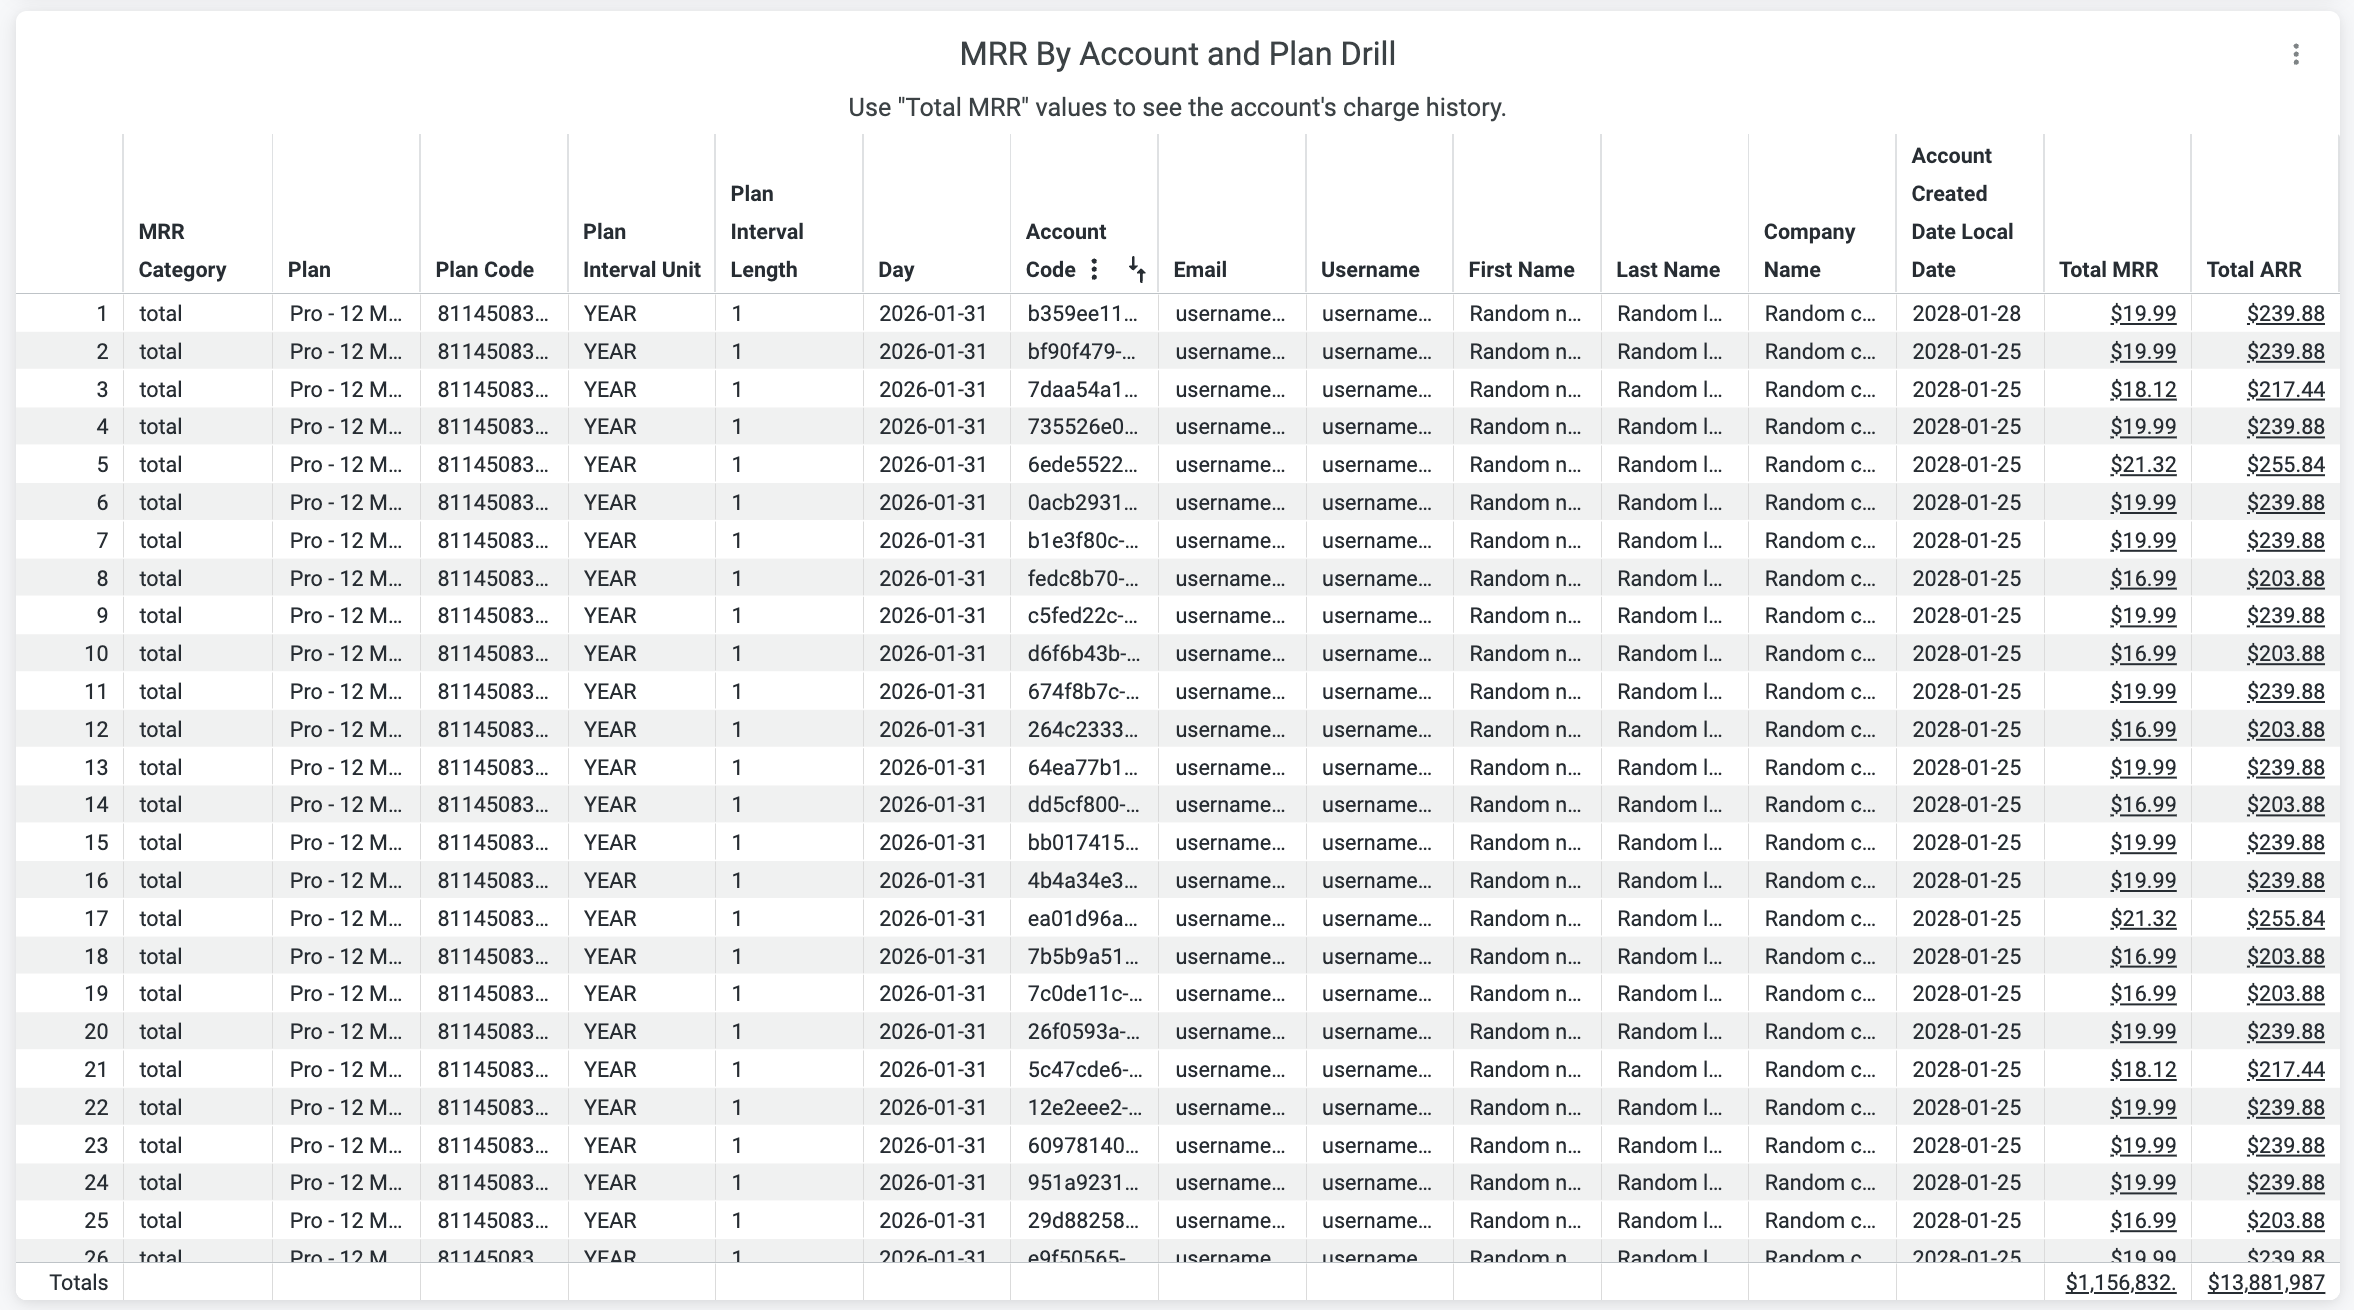
This chart includes two drills for deeper analysis:
- By account and plan
- By account, plan, and add-on
Plans drill:
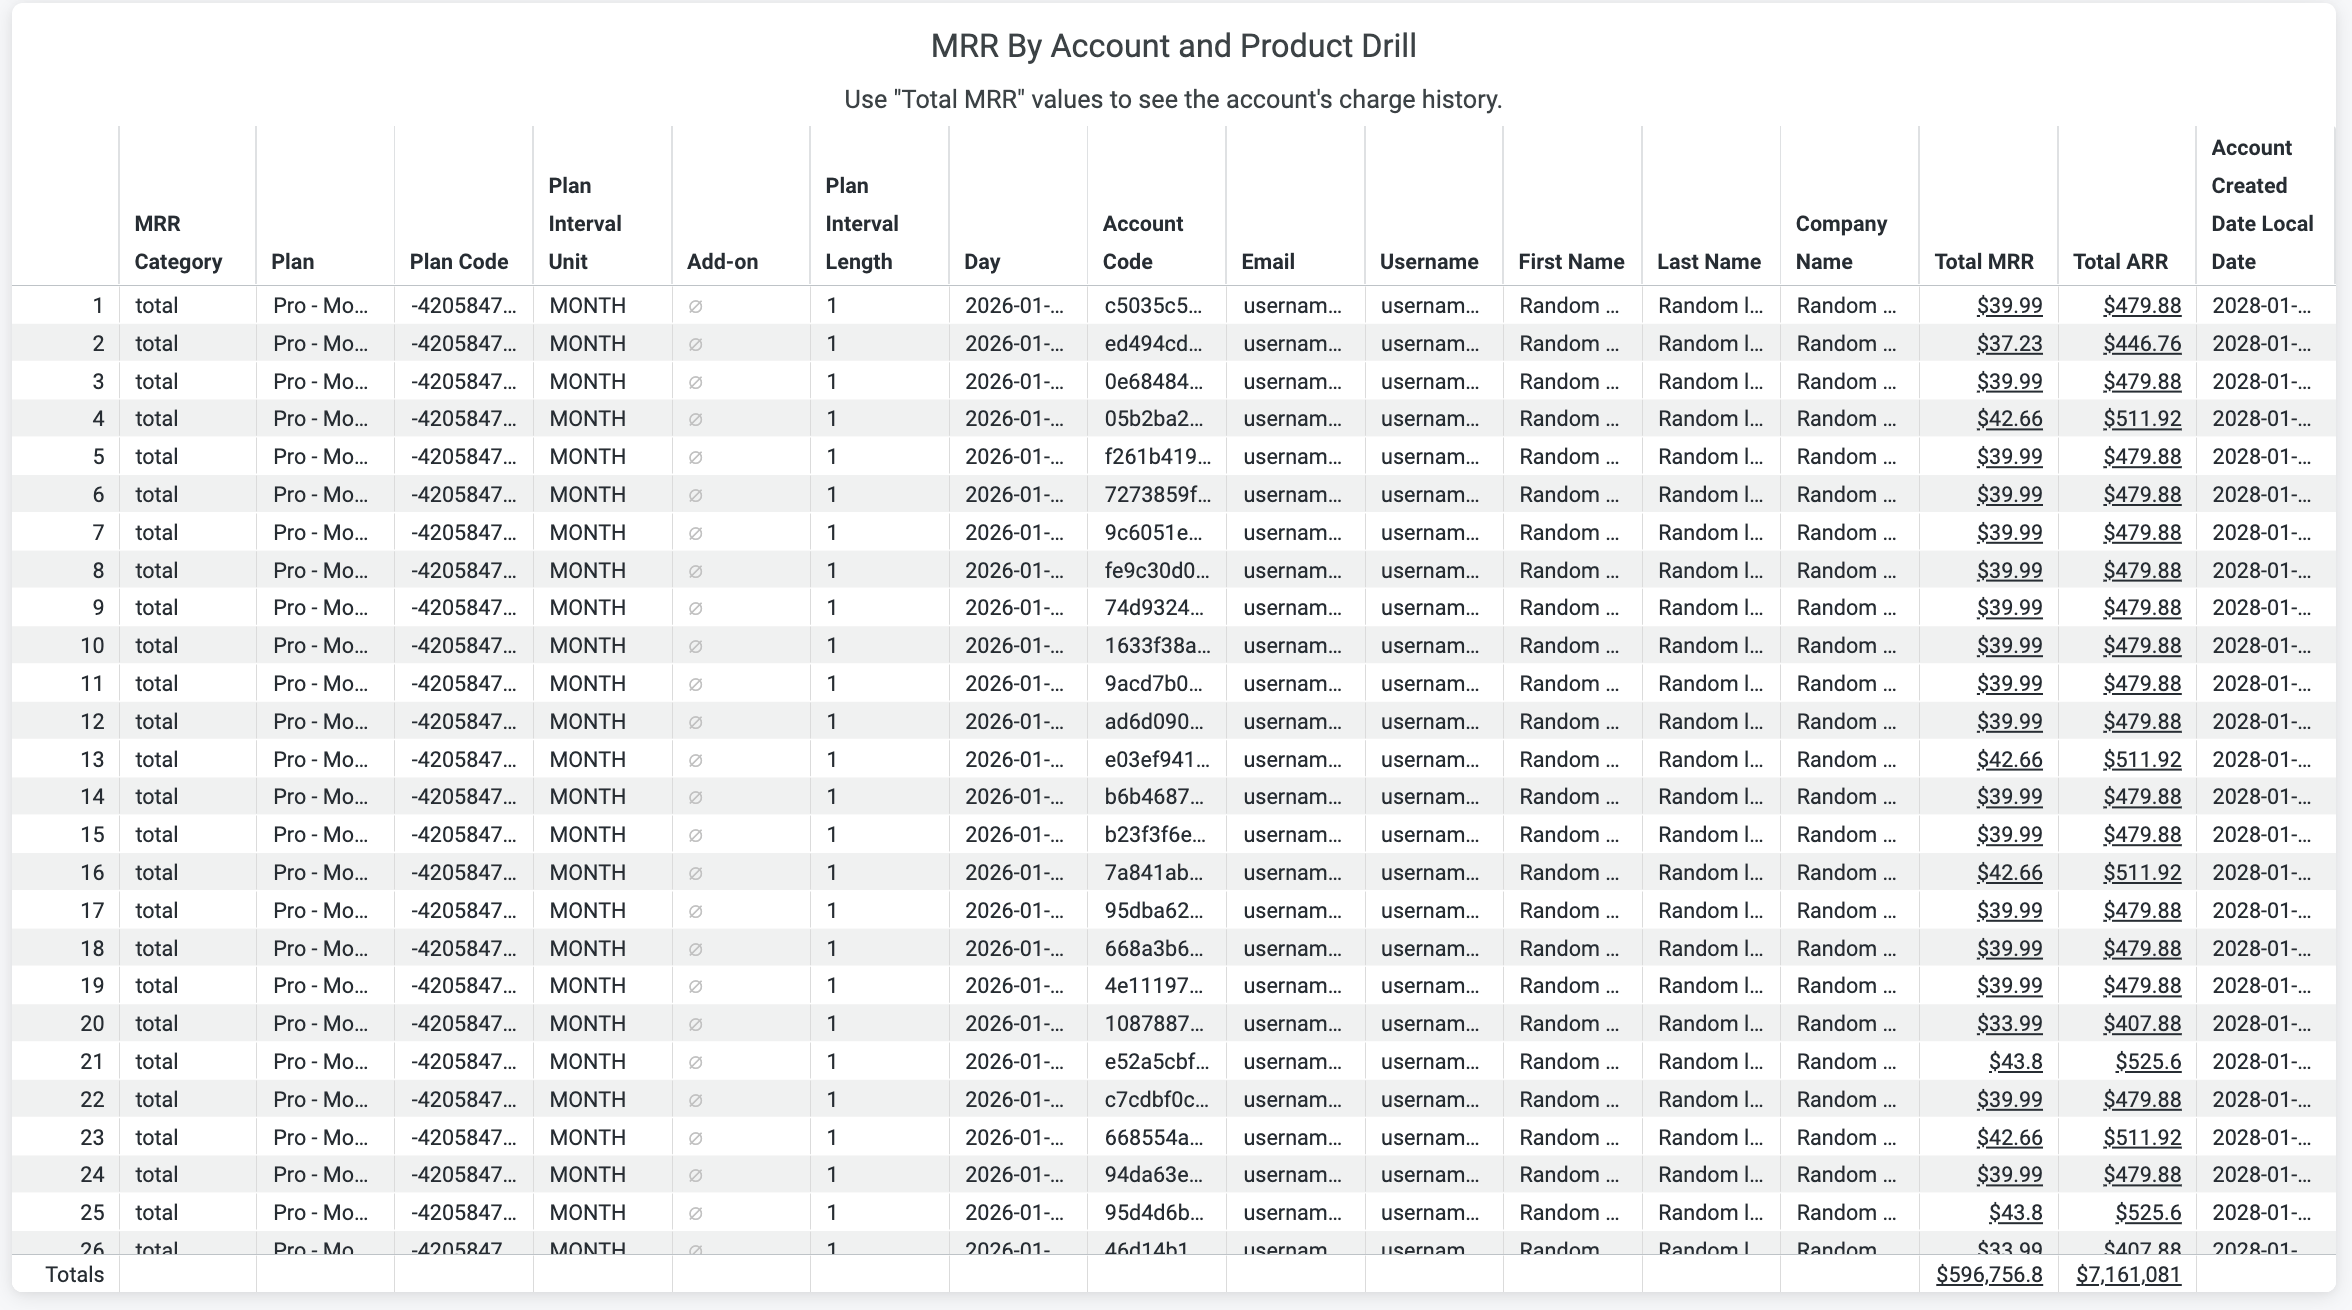
Plans and add-ons drill:
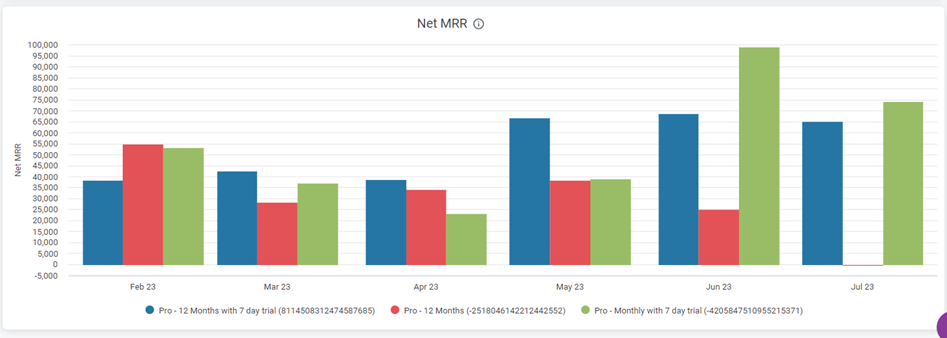
Net MRR
The Net MRR bar chart shows the net impact of subscription changes on overall MRR, calculated as:
(New MRR + Expansion MRR + Reactivation MRR) − (Churn MRR + Declined MRR)
MRR growth breakout charts
The five charts in this section each track a distinct MRR change category. Together, they help you pinpoint what's driving growth or contraction in any given period.
New MRR — MRR from newly acquired subscribers
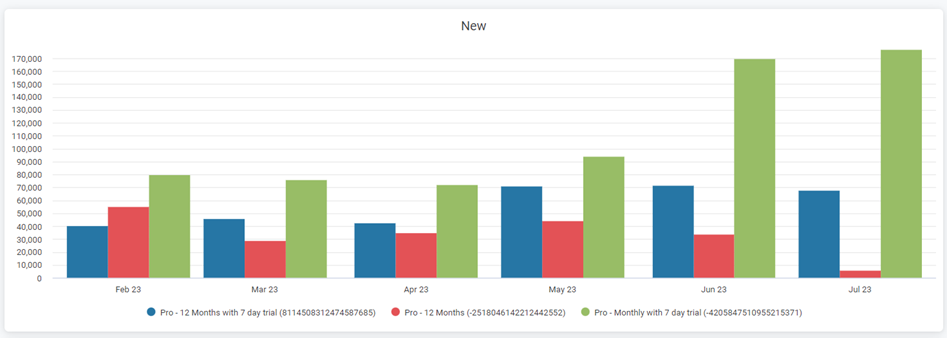
New MRR
Expansion MRR — MRR gained from existing subscribers upgrading or adding to their plans
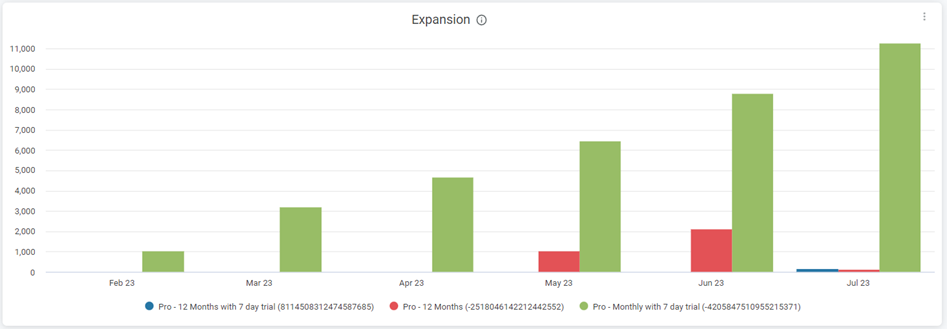
Expansion MRR
Reactivation MRR — MRR recovered from previously churned subscribers who reactivated
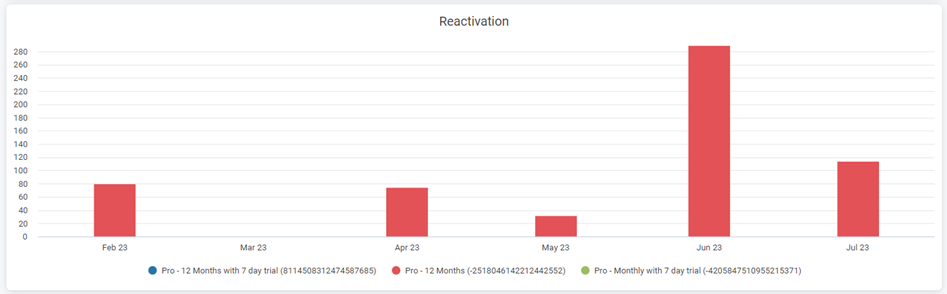
Reactivation MRR
Churn MRR — MRR lost from subscribers who canceled or did not renew
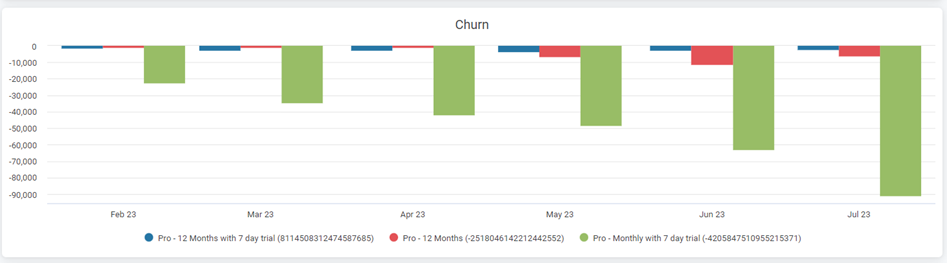
Churn MRR
Contraction MRR — MRR lost from existing subscribers who downgraded their plans
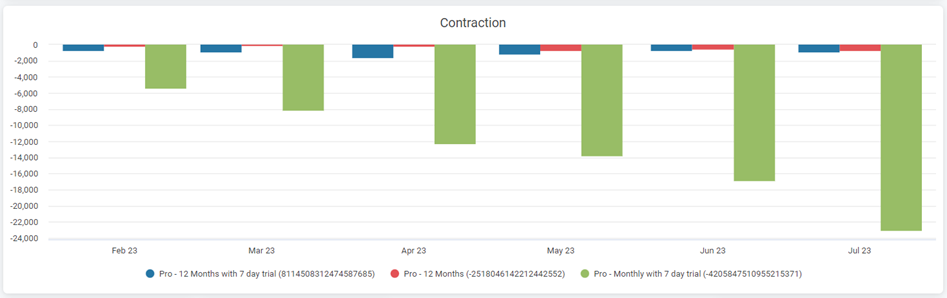
Contraction MRR
All five charts support drills that adjust based on the selected MRR level.

Updated about 2 months ago