Dunning benchmarks
Built-in dunning benchmarks allow merchants to see their key performance metrics, related to subscribers, how they stack against similar companies within their industry, and how they’re trending.
Overview
Required plan
This feature or setting is available to all customers on any Recurly subscription plan.
Prerequisites
- Users must have analytics user role permission.
Definition
The dunning benchmark dashboard will provide insights on your Dunning Recovery Rate, comparing yourself to others in your industry with Recurly’s built-in benchmarks.
Key benefits
-
Industry comparison: Compare key subscription metrics with industry benchmarks to understand performance relative to peers, identifying areas of strengths and weaknesses.
-
Competitive insights: Gain insights into how competitors are faring in terms of subscription metrics, uncovering areas to differentiate and improve to gain a competitive edge.
-
Informed decision-making: Make informed decisions based on real-world data to help set realistic goals and expectations for subscription growth and customer retention.
-
Forecasting and planning: Enable more accurate forecasting and long-term planning to help businesses set reachable growth targets and allocate resources effectively.
Key details
General filters (top left corner)
- Date range: This lets you modify the time period for benchmark comparisons, with a default duration of 14 months, allowing for extensive analysis over time.
- Industry: Shows benchmark data tailored to the industry you select, providing insights relevant to your sector.
- Timeframe: A preset filter that provides a monthly overview of benchmark metrics, ensuring consistency in the data you're reviewing.
- Subscriber type: This filter is fixed to “Paying Subscribers,” focusing the benchmarks on subscribers who have made at least one payment, ensuring the data reflects genuine customer engagement.
Dunning benchmarks
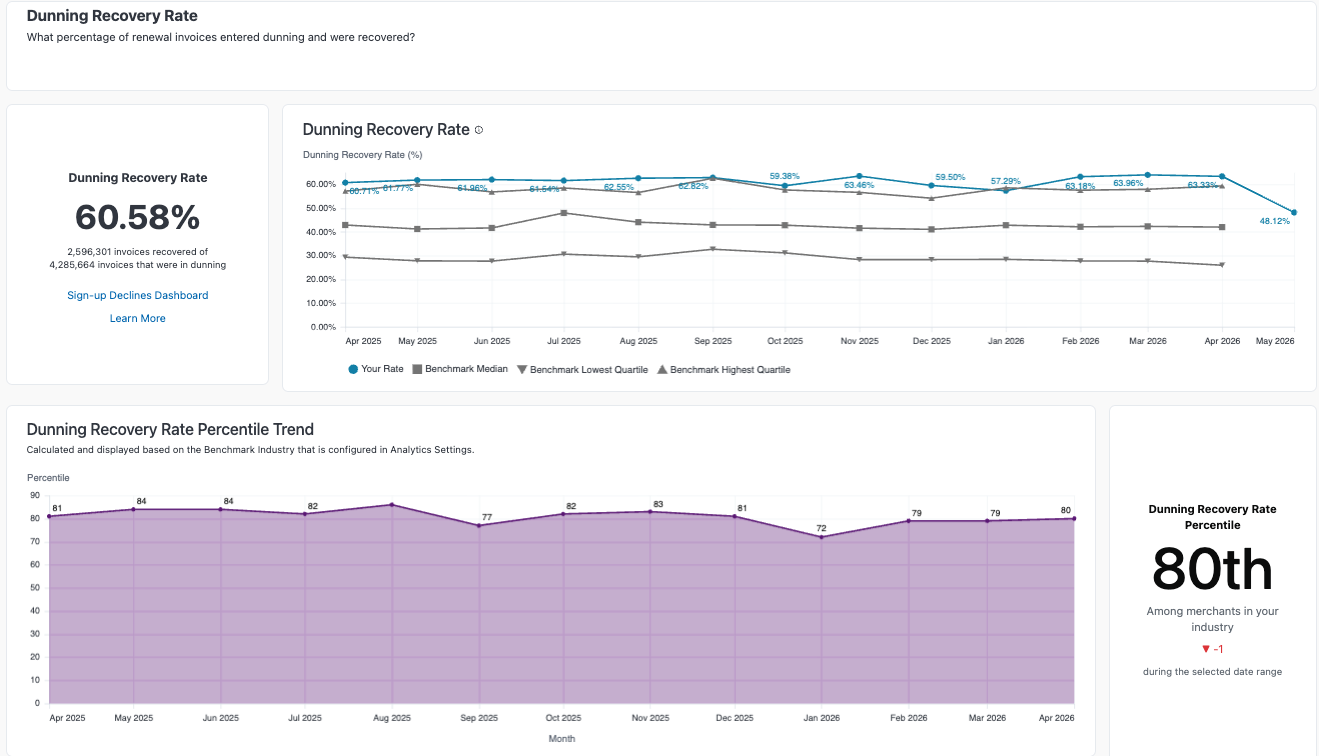
The Dunning Benchmarks dashboard will enable you to understand how you compare to peers in your industry with regards to recovering invoices that fail and enter dunning. This will allow you to make adjustments to your dunning strategy to make incremental progress to increase your recovery rate as compared to your industry.
Dunning recovery rate calculation
This metric measures the effectiveness of your dunning process by calculating the percentage of invoices that are successfully recovered after initially entering the dunning process.
Your performance is contextualized within your industry through a percentile ranking, showing how you compare to peers. Monitoring your percentile trend over time offers insights into the effectiveness of your dunning strategies relative to the industry.
Here’s how it’s determined:
-
Formula: The rate is calculated by dividing the number of invoices that are recovered during the dunning process by the total number of invoices that entered dunning.
-
Time basis: Calculations are based on the invoice creation date, aligning this metric with the methodology used for renewal invoice decline and success rate benchmarks.
Your performance is contextualized within your industry through a percentile ranking, showing how you compare to peers. Monitoring your percentile trend over time offers insights into the effectiveness of your dunning strategies relative to the industry.
About benchmarks
Recurly's benchmark reports offer insights into your performance metrics compared to similar businesses in your industry over time. This tool helps you understand your competitive position and identify growth opportunities by comparing your key performance indicators (KPIs) with industry standards.
Updated about 2 months ago