Overview: Performance
Overview of the Performance tab for monitoring prompt and guide metrics in Recurly Engage.
Overview
Required plan
This feature or setting is available to all customers on any Recurly Engage subscription plan.
Prerequisites & limitations
Prerequisites & limitations
You must have Company, App Administrator, or App Member permissions in Recurly Engage.
Data reflects the selected date range; historical data availability depends on your account’s retention settings.
Definition
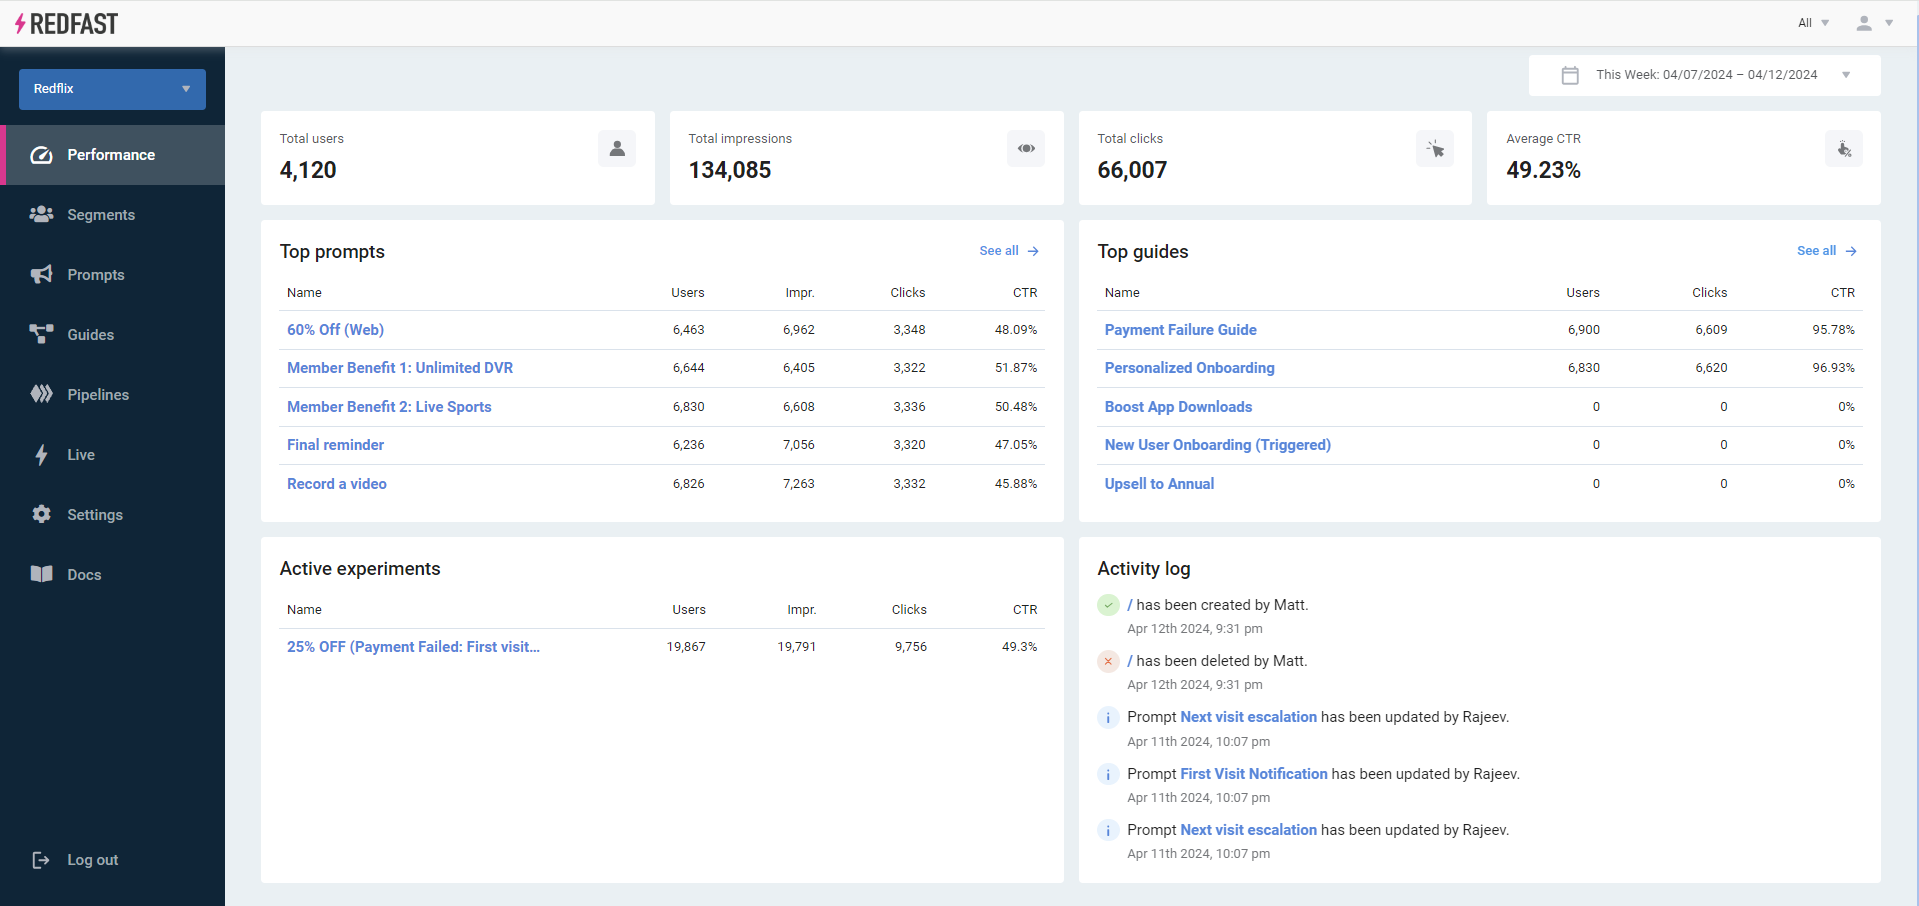
The Performance tab aggregates usage data—users, impressions, clicks, and conversions—across prompts, guides, and experiments, with insights into top performers and recent activity.
Key benefits
- Holistic overview: Monitor total users, impressions, clicks, and average CTR at a glance.
- Top performers: Identify your Top 5 prompts and guides by engagement metrics.
- Experiment insights: Track active experiments and their leading variations.
- Activity log: Stay informed on recent changes to prompts, triggers, and actions.
Key details
By default, the Performance tab shows weekly statistics. Update the date range by clicking on the date picker in the upper-right corner of the screen.
Here you can access:
- Total Users: Users who visited your site or app within the selected date range.
- Total Impressions: Times your prompts were displayed in that period.
- Total Clicks: Number of times users accepted prompts by clicking CTA buttons.
- Average CTR: Clicks divided by impressions (click-through rate).
- Top 5 Prompts and Top 5 Guides: Ranked by performance with high-level metrics for each.
- Active Experiments: Running A/B tests with the highest conversion counts.
- Activity Log: Timeline of recent updates to prompts, triggers, and actions.
Updated 12 months ago