Experiments
Guide to creating and running A/B tests (experiments) on your prompts in Recurly Engage.
Overview
Experiments enable you to test multiple variations of a prompt—copy, design, triggers, actions—to identify which version drives the best performance based on your conversion goals.
Required plan
This feature or setting is available to all customers on any Recurly Engage subscription plan.
Prerequisites & limitations
You must have Company, App Administrator, or App Member permissions in Recurly Engage.
Only one active experiment may run per prompt at a time; historical experiments remain accessible.
A minimum of 30 users and 5 conversions per variation is recommended for statistical reliability.
Definition
An experiment divides traffic among a prompt’s variations (including an optional control group) and measures conversions—with statistical tests—to determine a winning configuration.
Key benefits
- Data-driven optimization: Use real user interactions to choose the best-performing variation.
- Controlled testing: Isolate single changes—title, imagery, behavior—to understand their impact.
- Seamless rollout: Promote the winning variation to replace the original prompt at experiment end.
Key details
What experiments can modify
- Prompt title and message body
- Call-to-action text and behaviors
- Images, styling, and layout
- Triggers, schedules, and actions (including 1-click workflows)
Traffic allocation
Assign any percentage of visitors to each variation and to a Control group (users who see no prompt). Control group users are still measured for conversion against your custom goal.
Statistical analysis
Experiments use a Z‑test to compare variation conversion rates against the control. To detect a meaningful lift (e.g., >5% improvement), each variation should see at least 30 users and 5 conversions—often requiring hundreds or thousands of users depending on baseline rate.
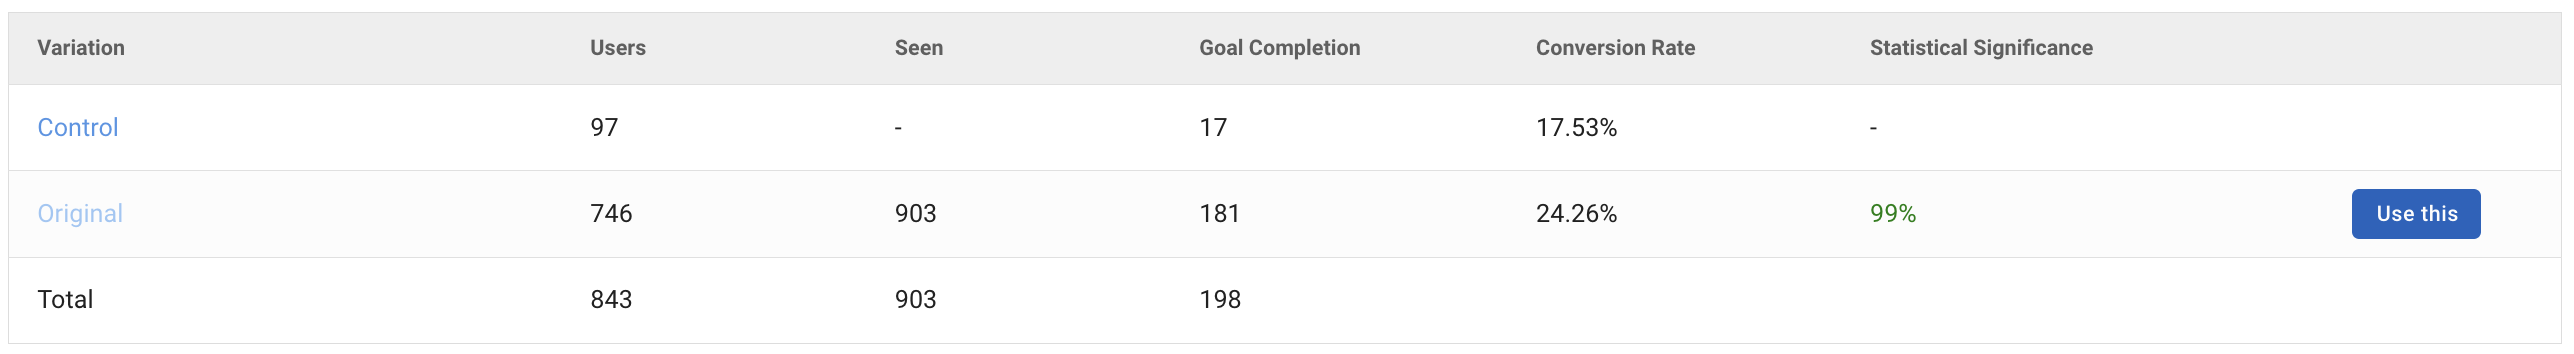
Once statistical significance is reached, click Use This to end the experiment and update your baseline prompt to the winning variation.
Note: Z‑test significance indicates superiority over control only; it does not compare variations against each other. We plan to support Bayesian methods in the future.
Step-by-step guide
- Navigate to Prompts and select the prompt you want to experiment on.
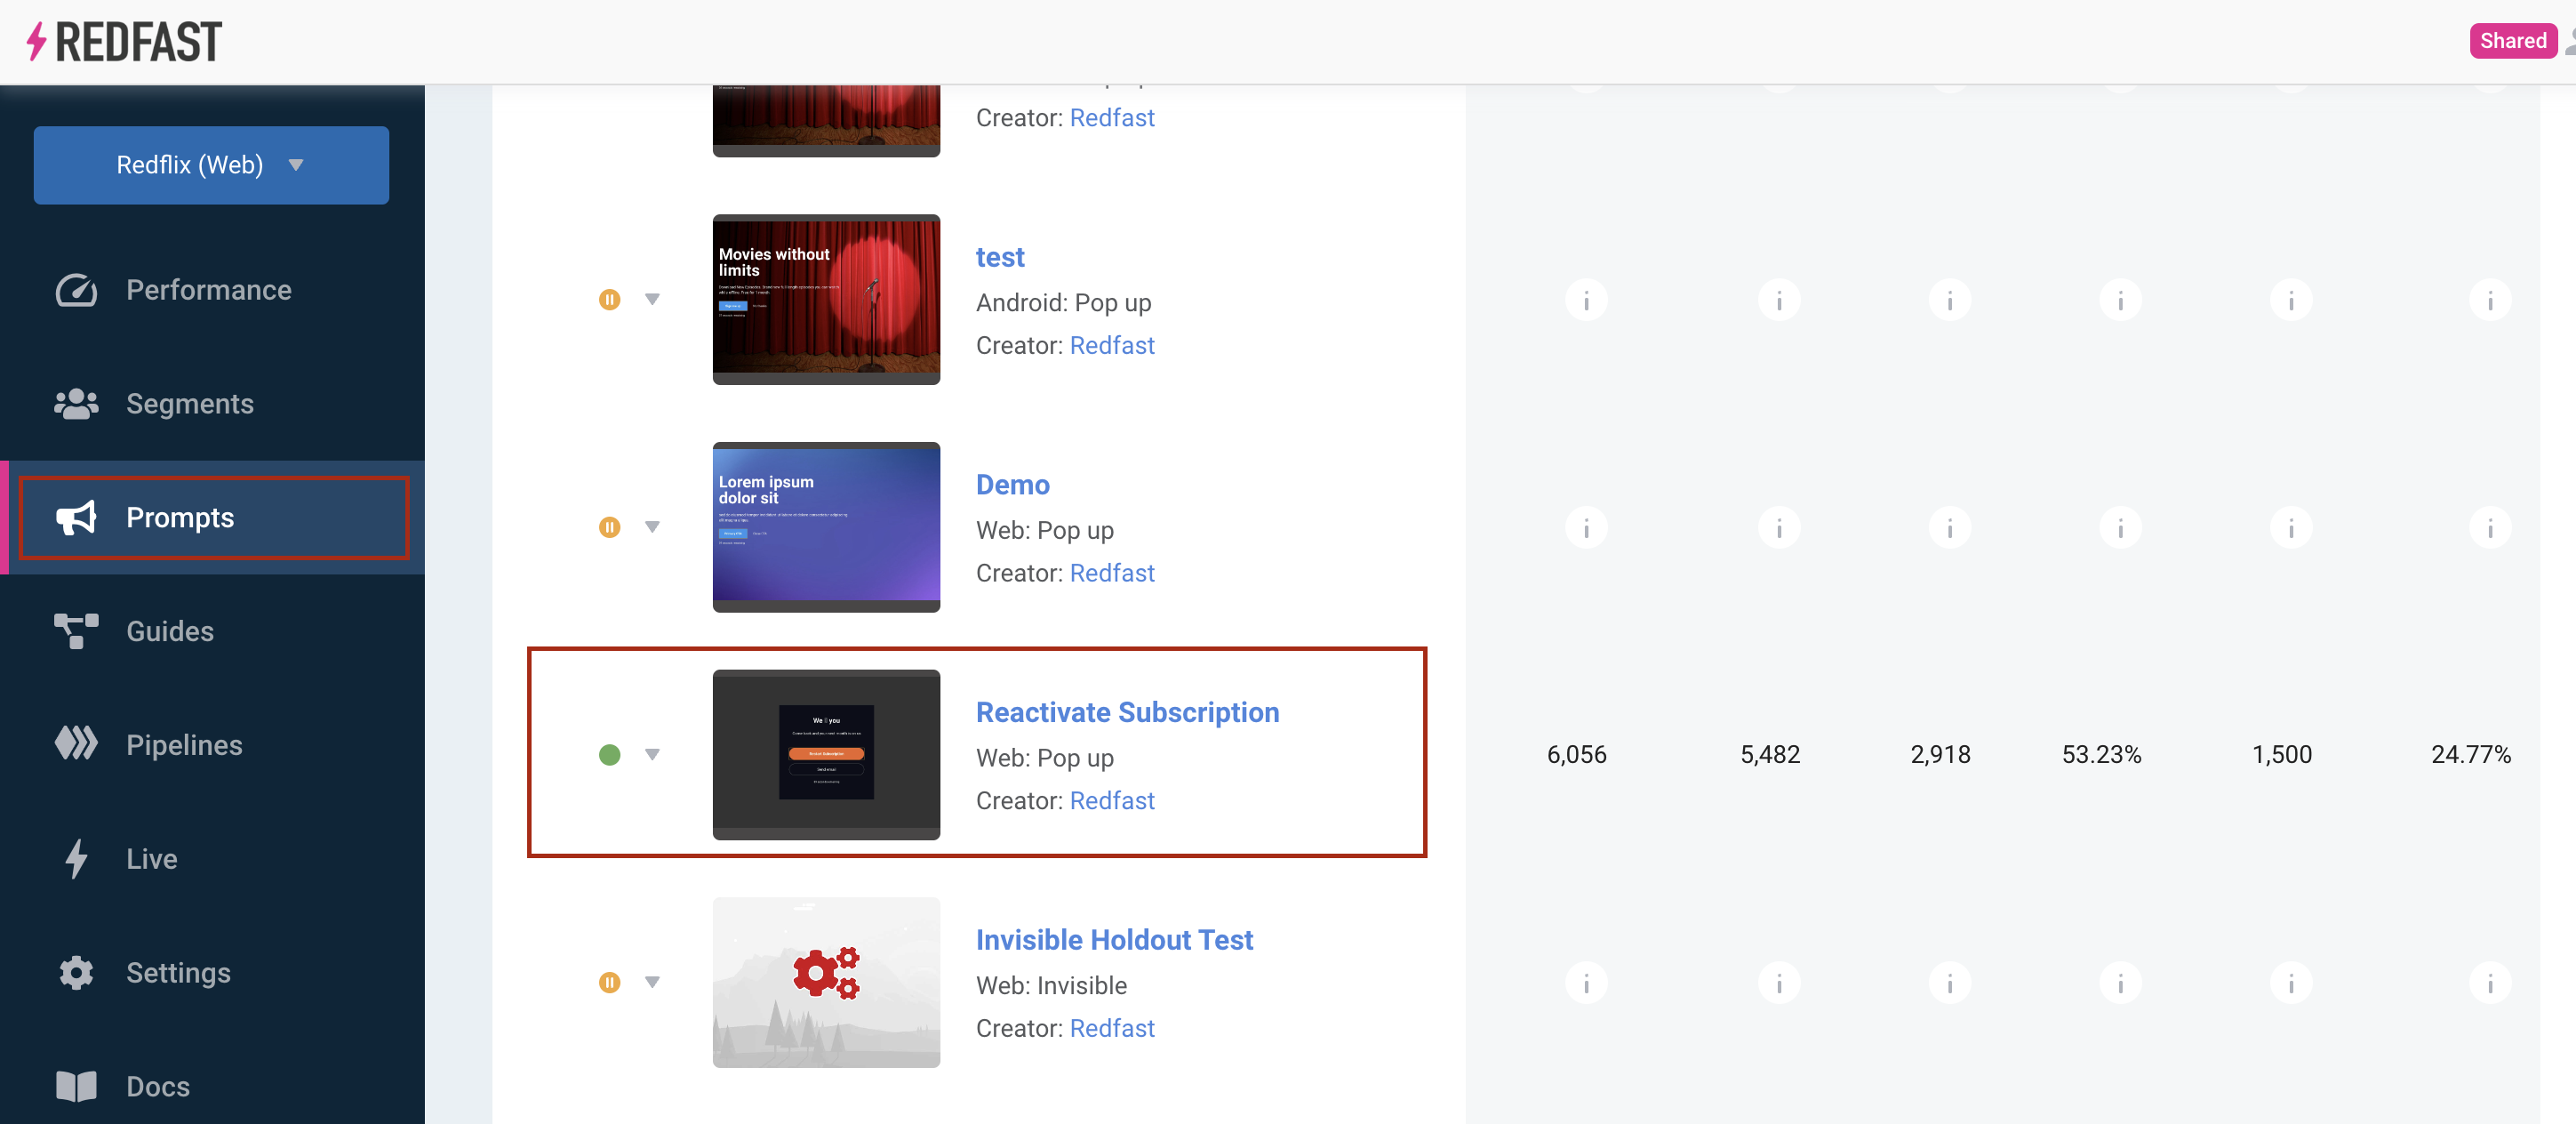
- Scroll to the Experiments section and click + New Experiment.
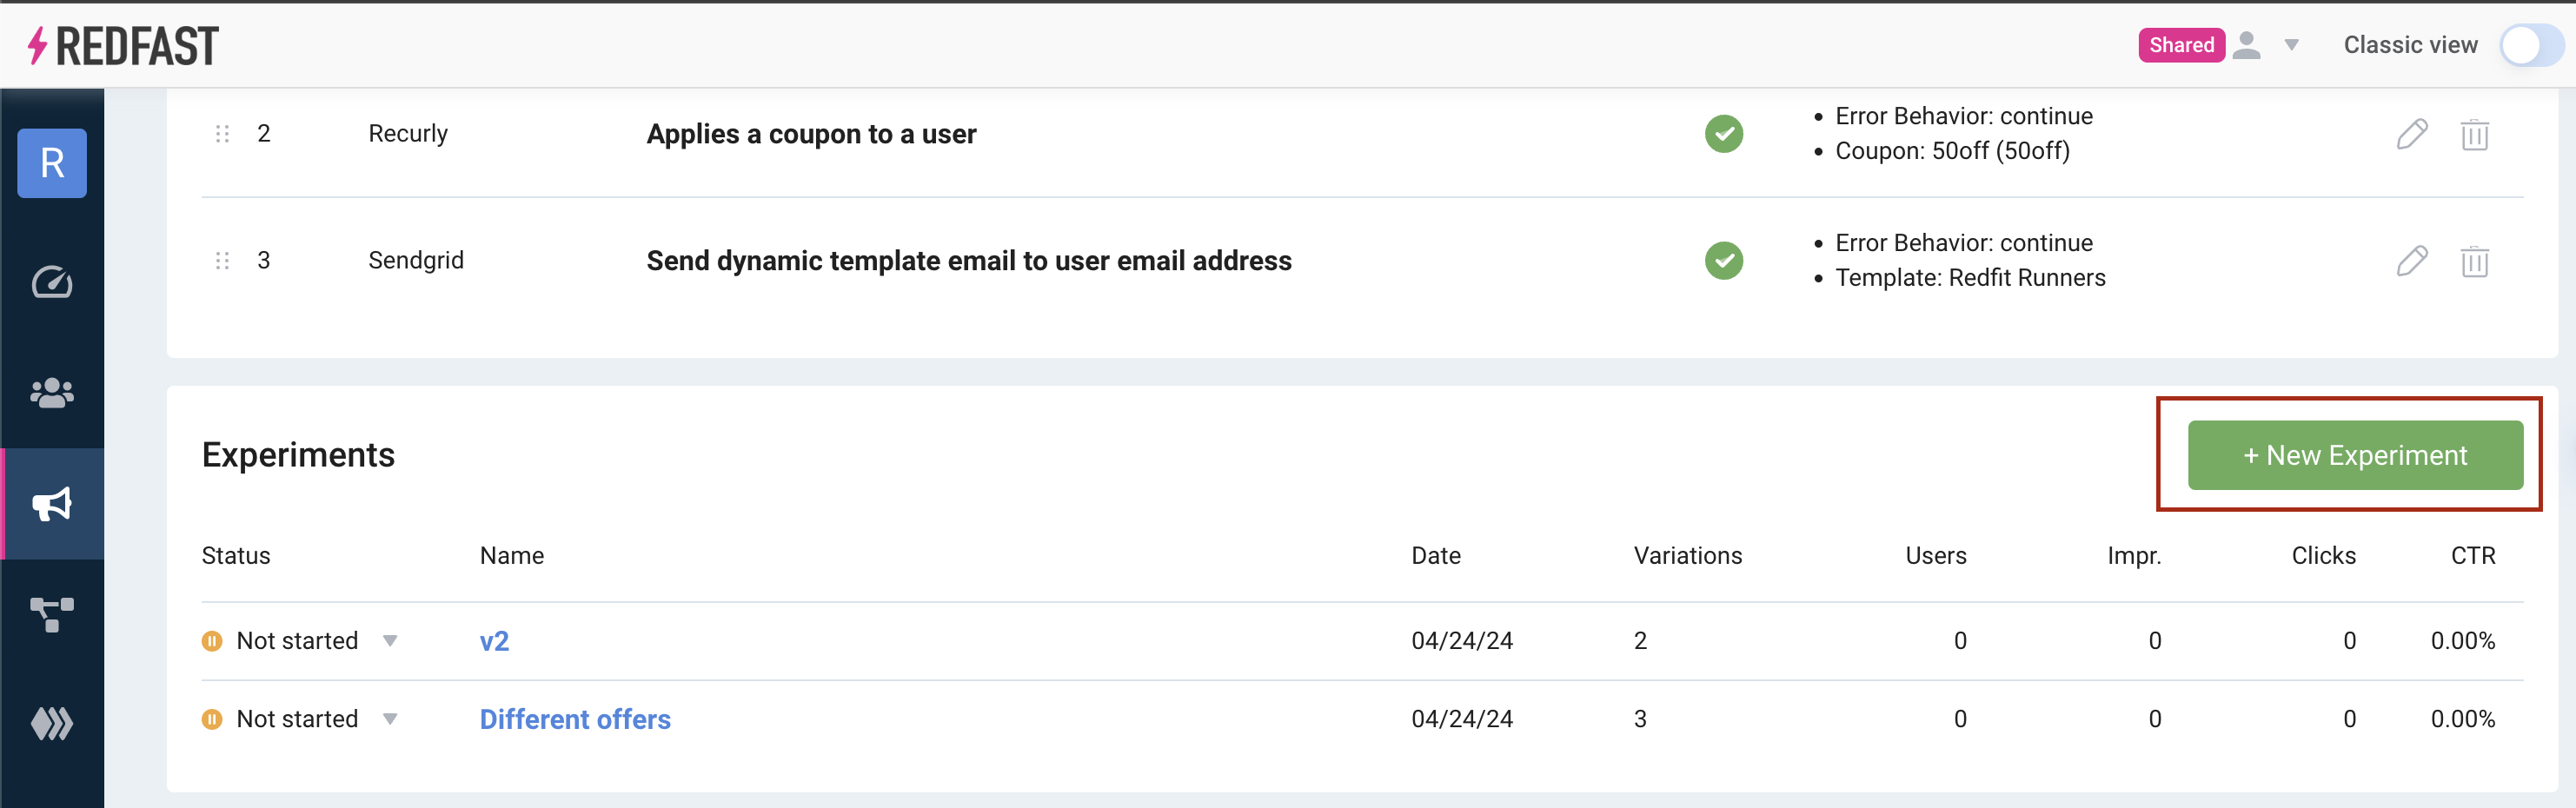
- Enter a clear experiment name.

- (Optional) Add a Control group if you have a custom goal configured—this measures baseline conversions without showing a prompt.
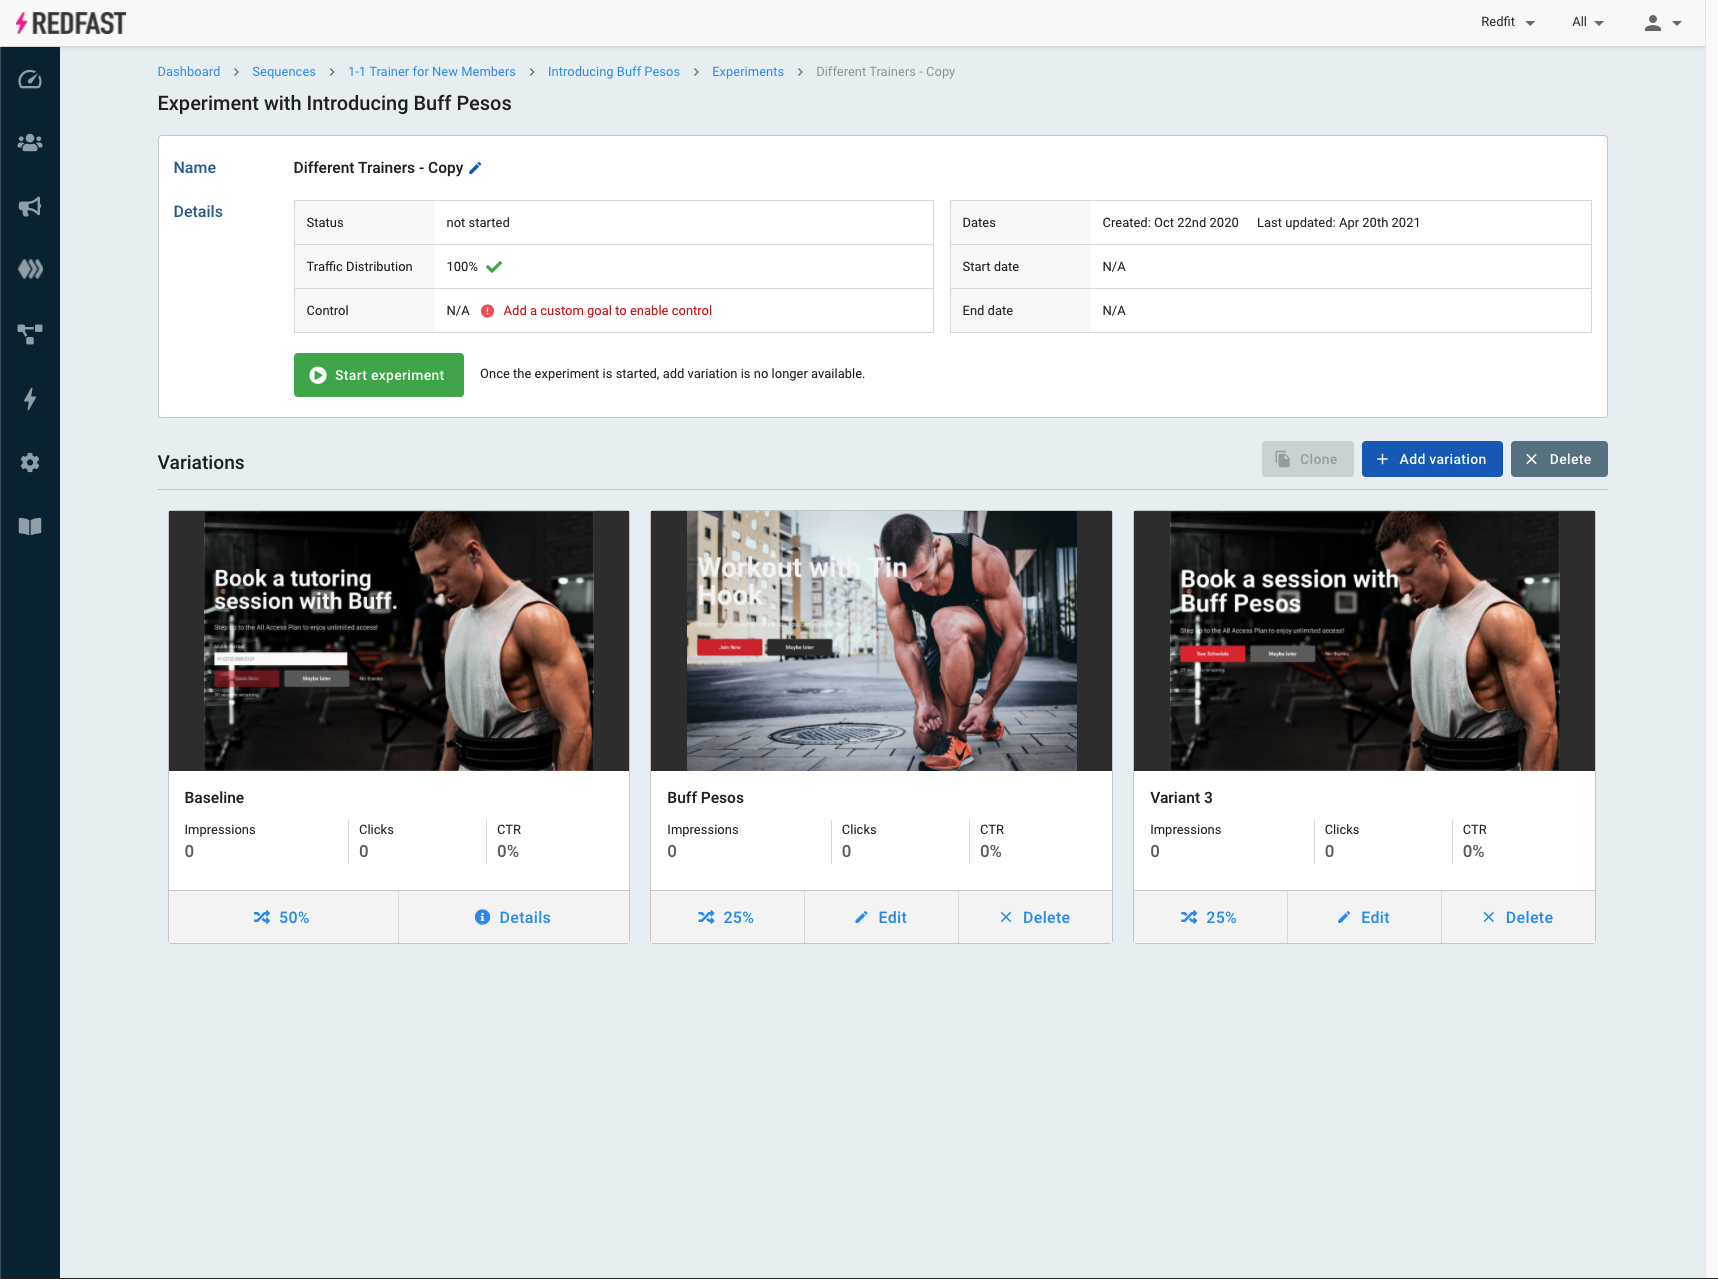
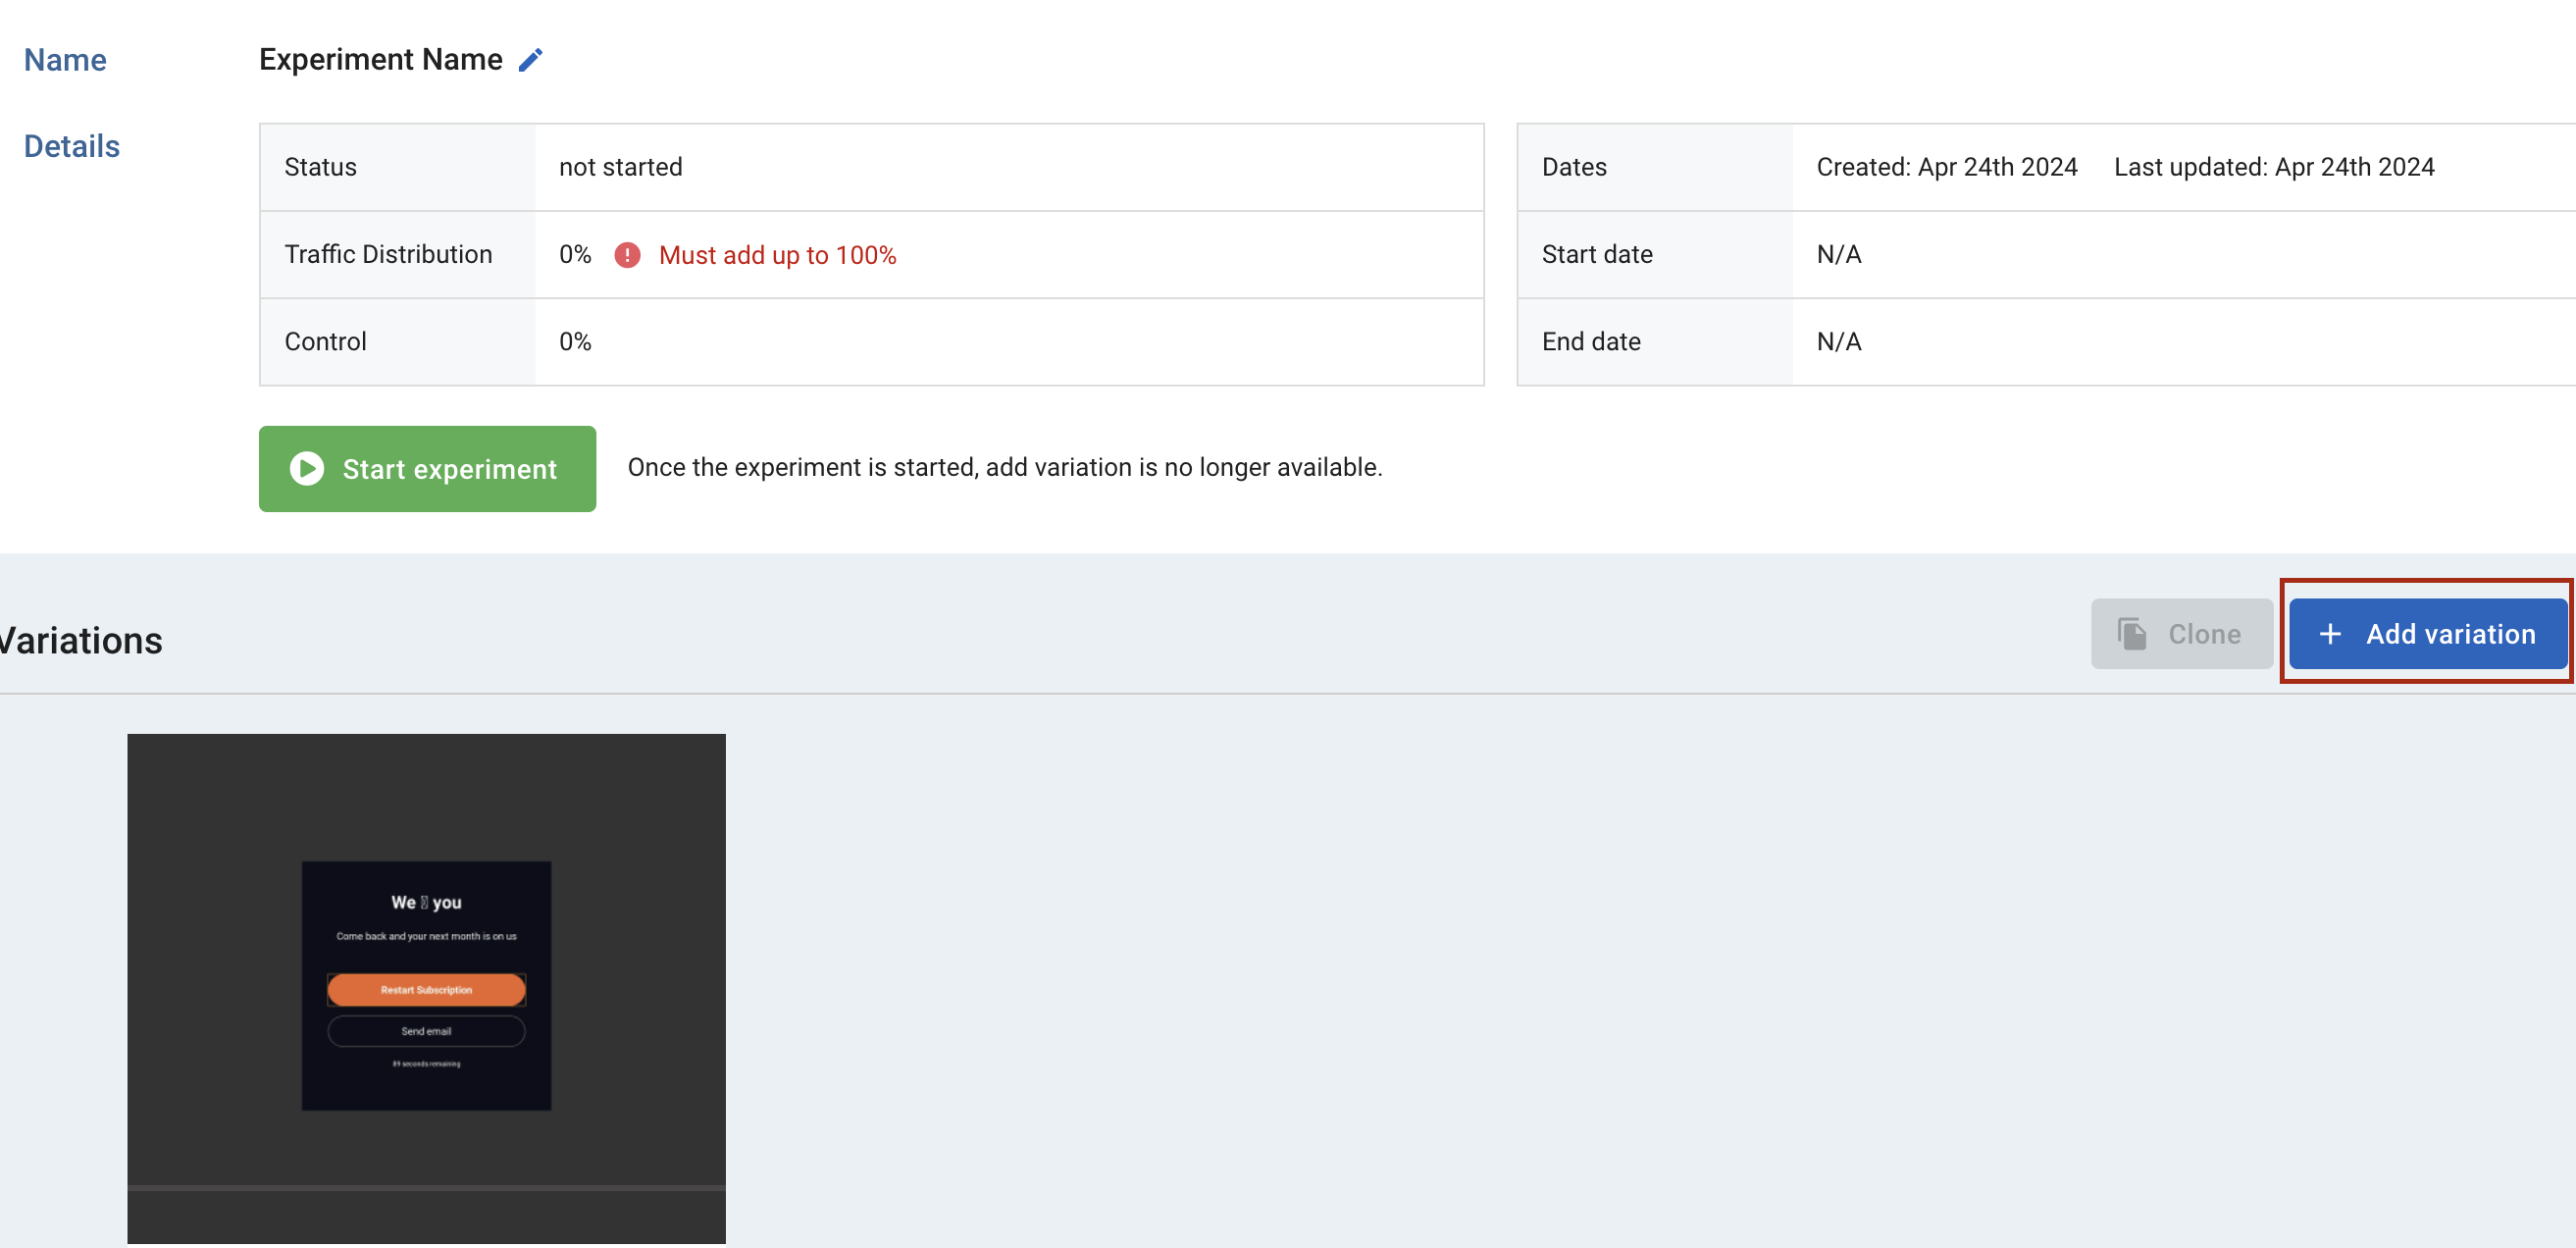
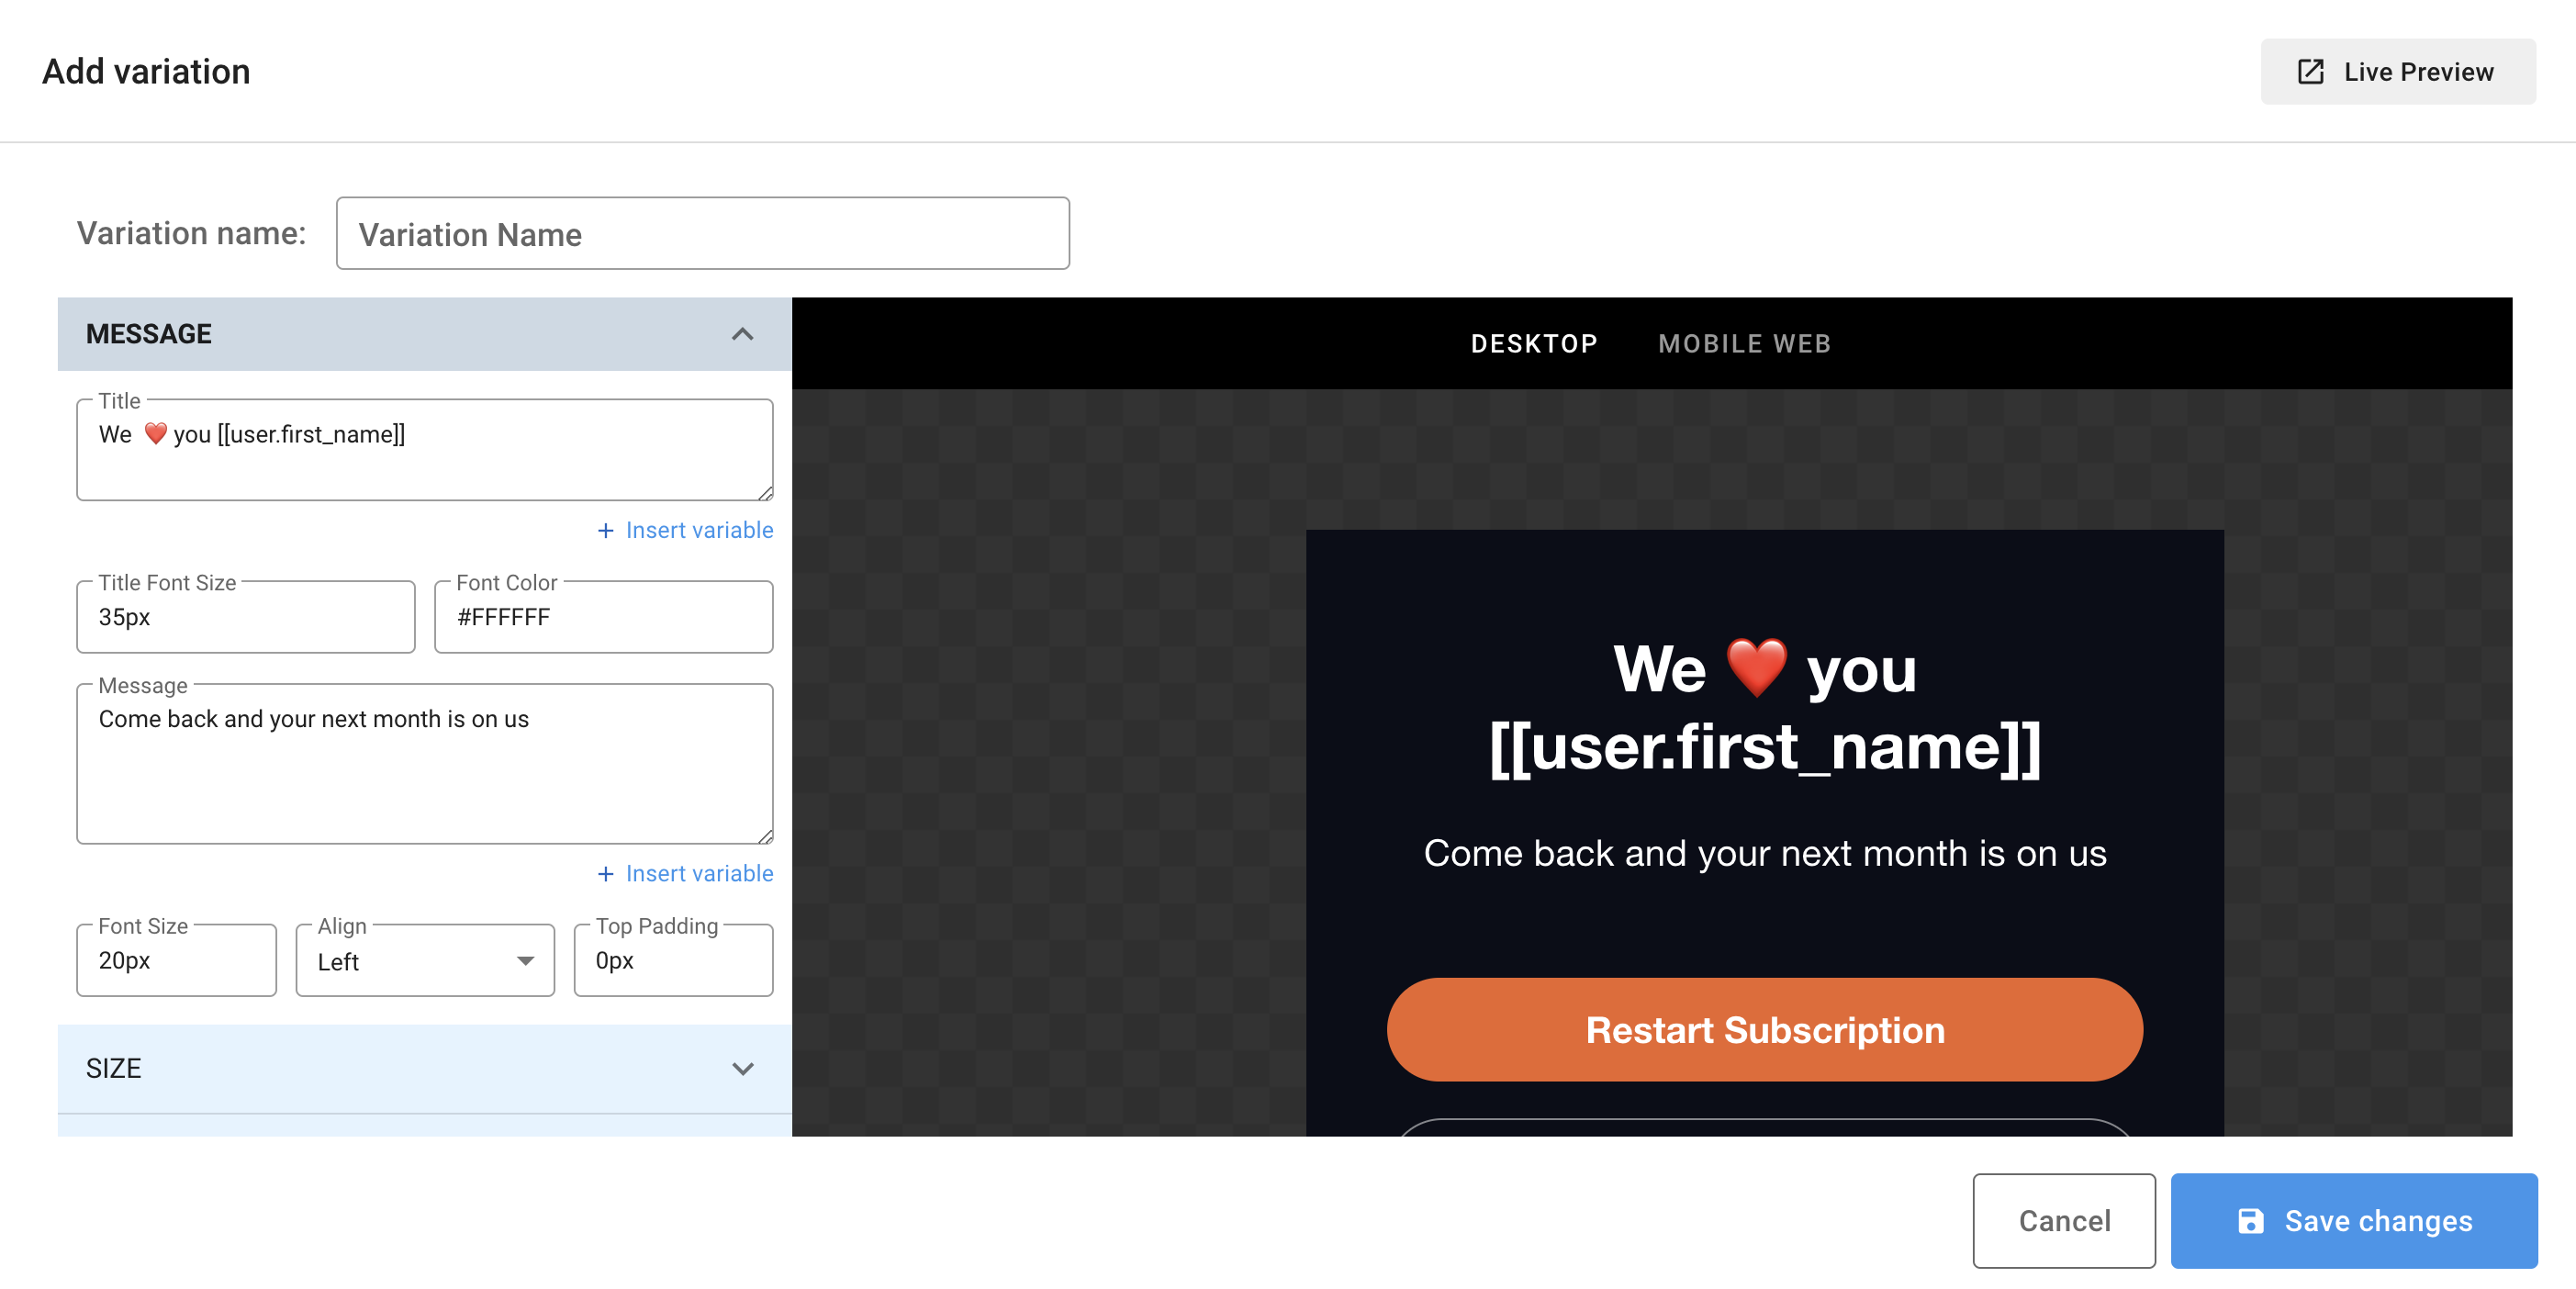
- Click Add variation, name it to reflect the change (e.g., “New headline”), and modify title, copy, imagery, triggers, or actions.
- Configure the variation details—edit directly in the prompt editor.
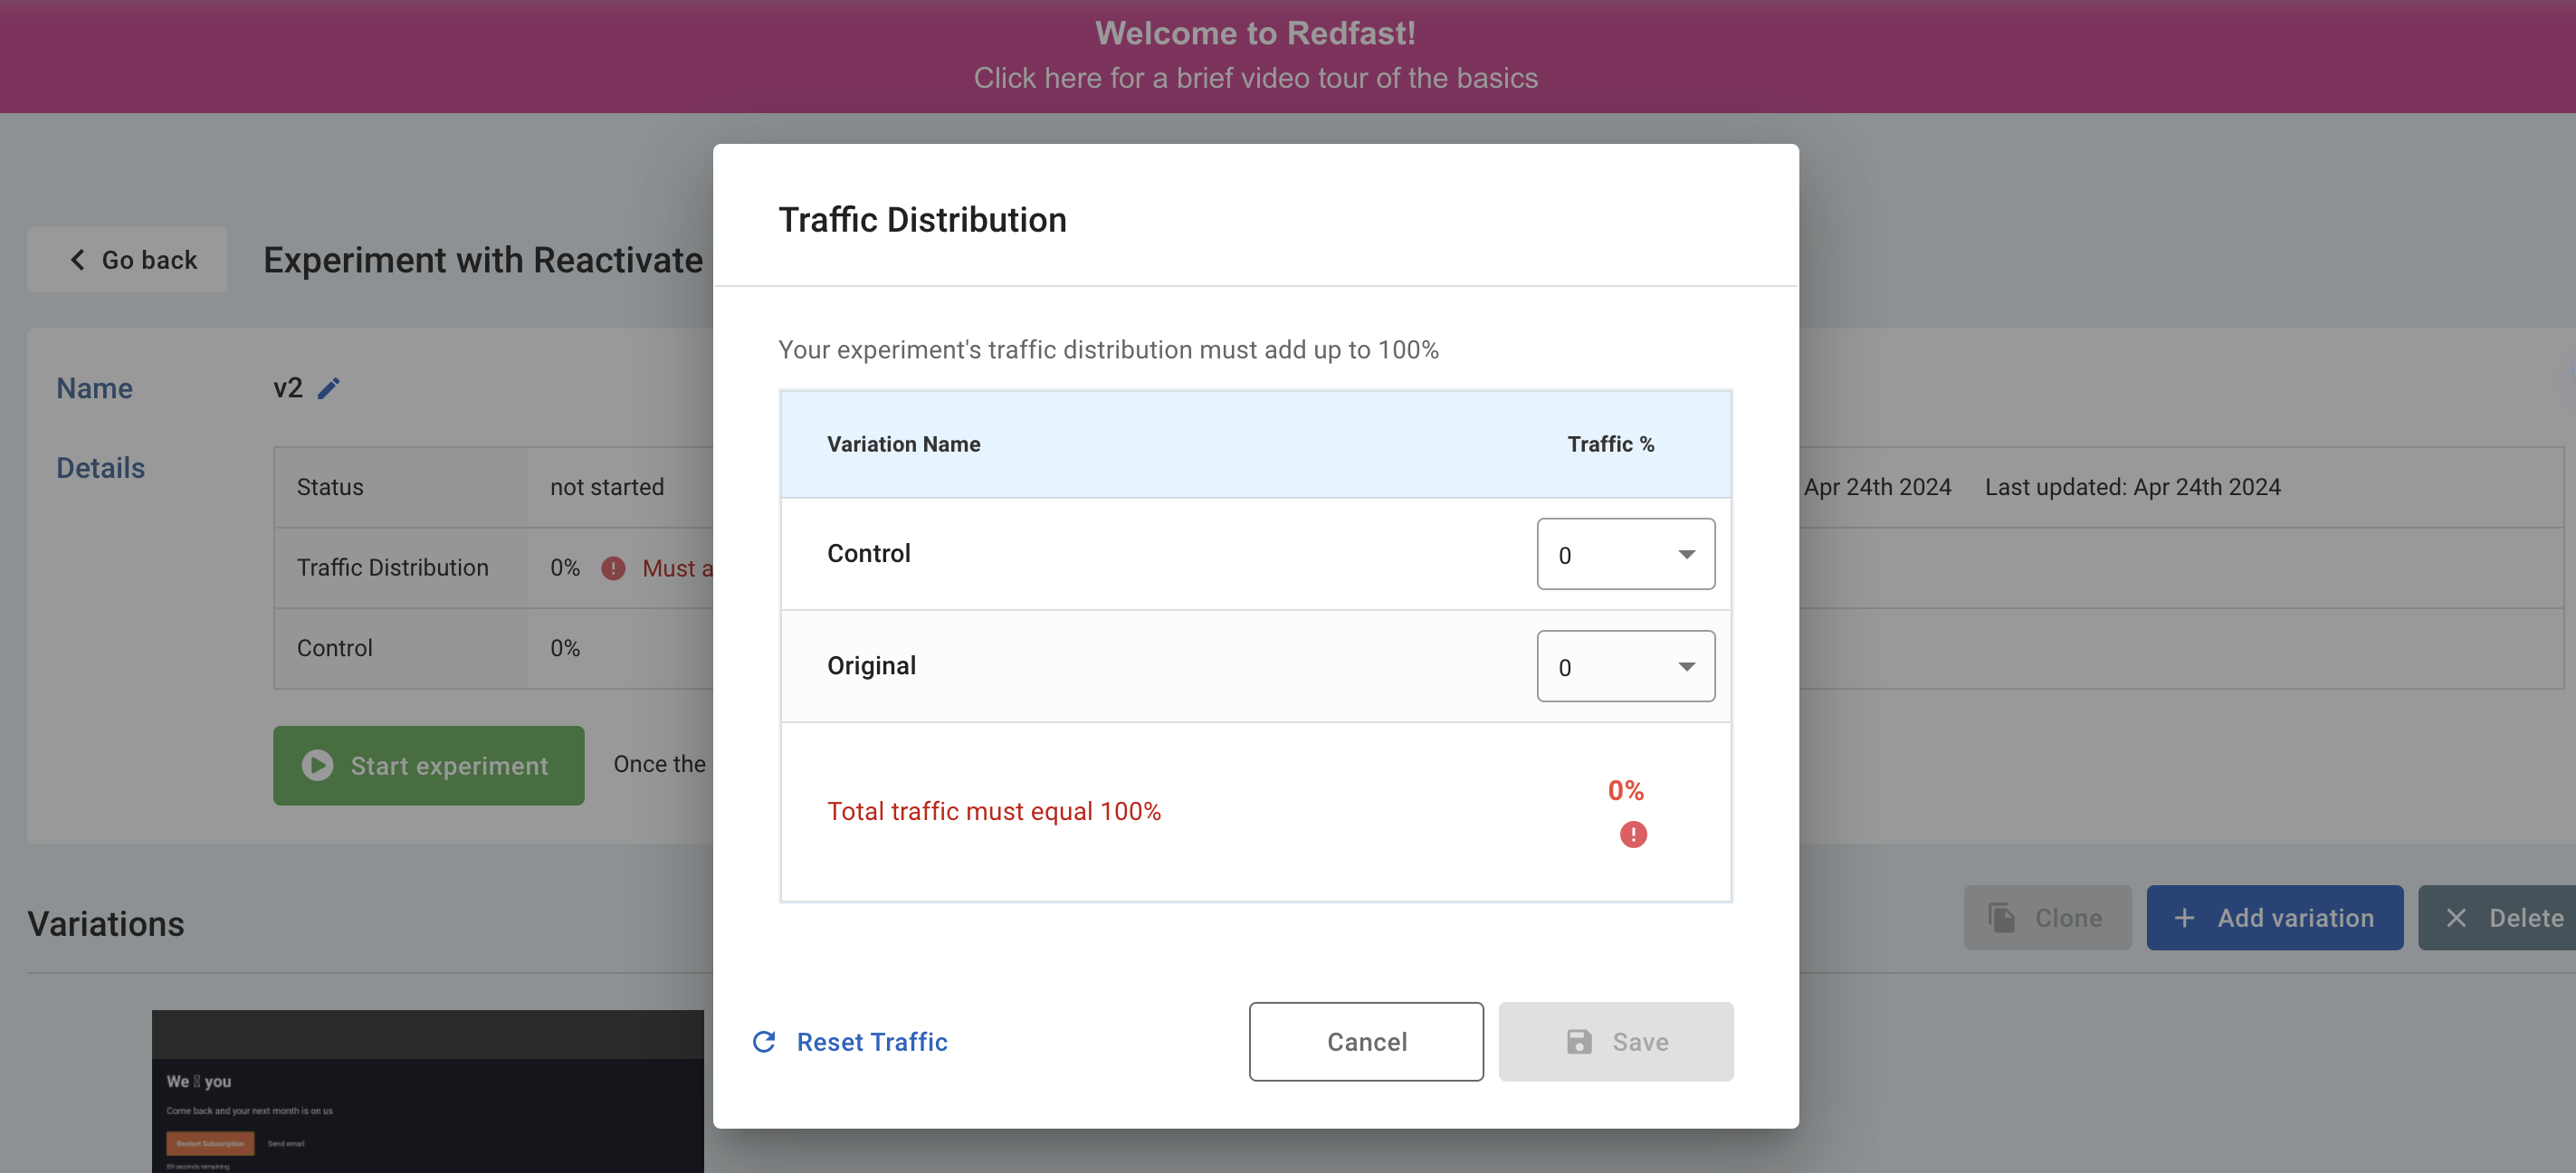
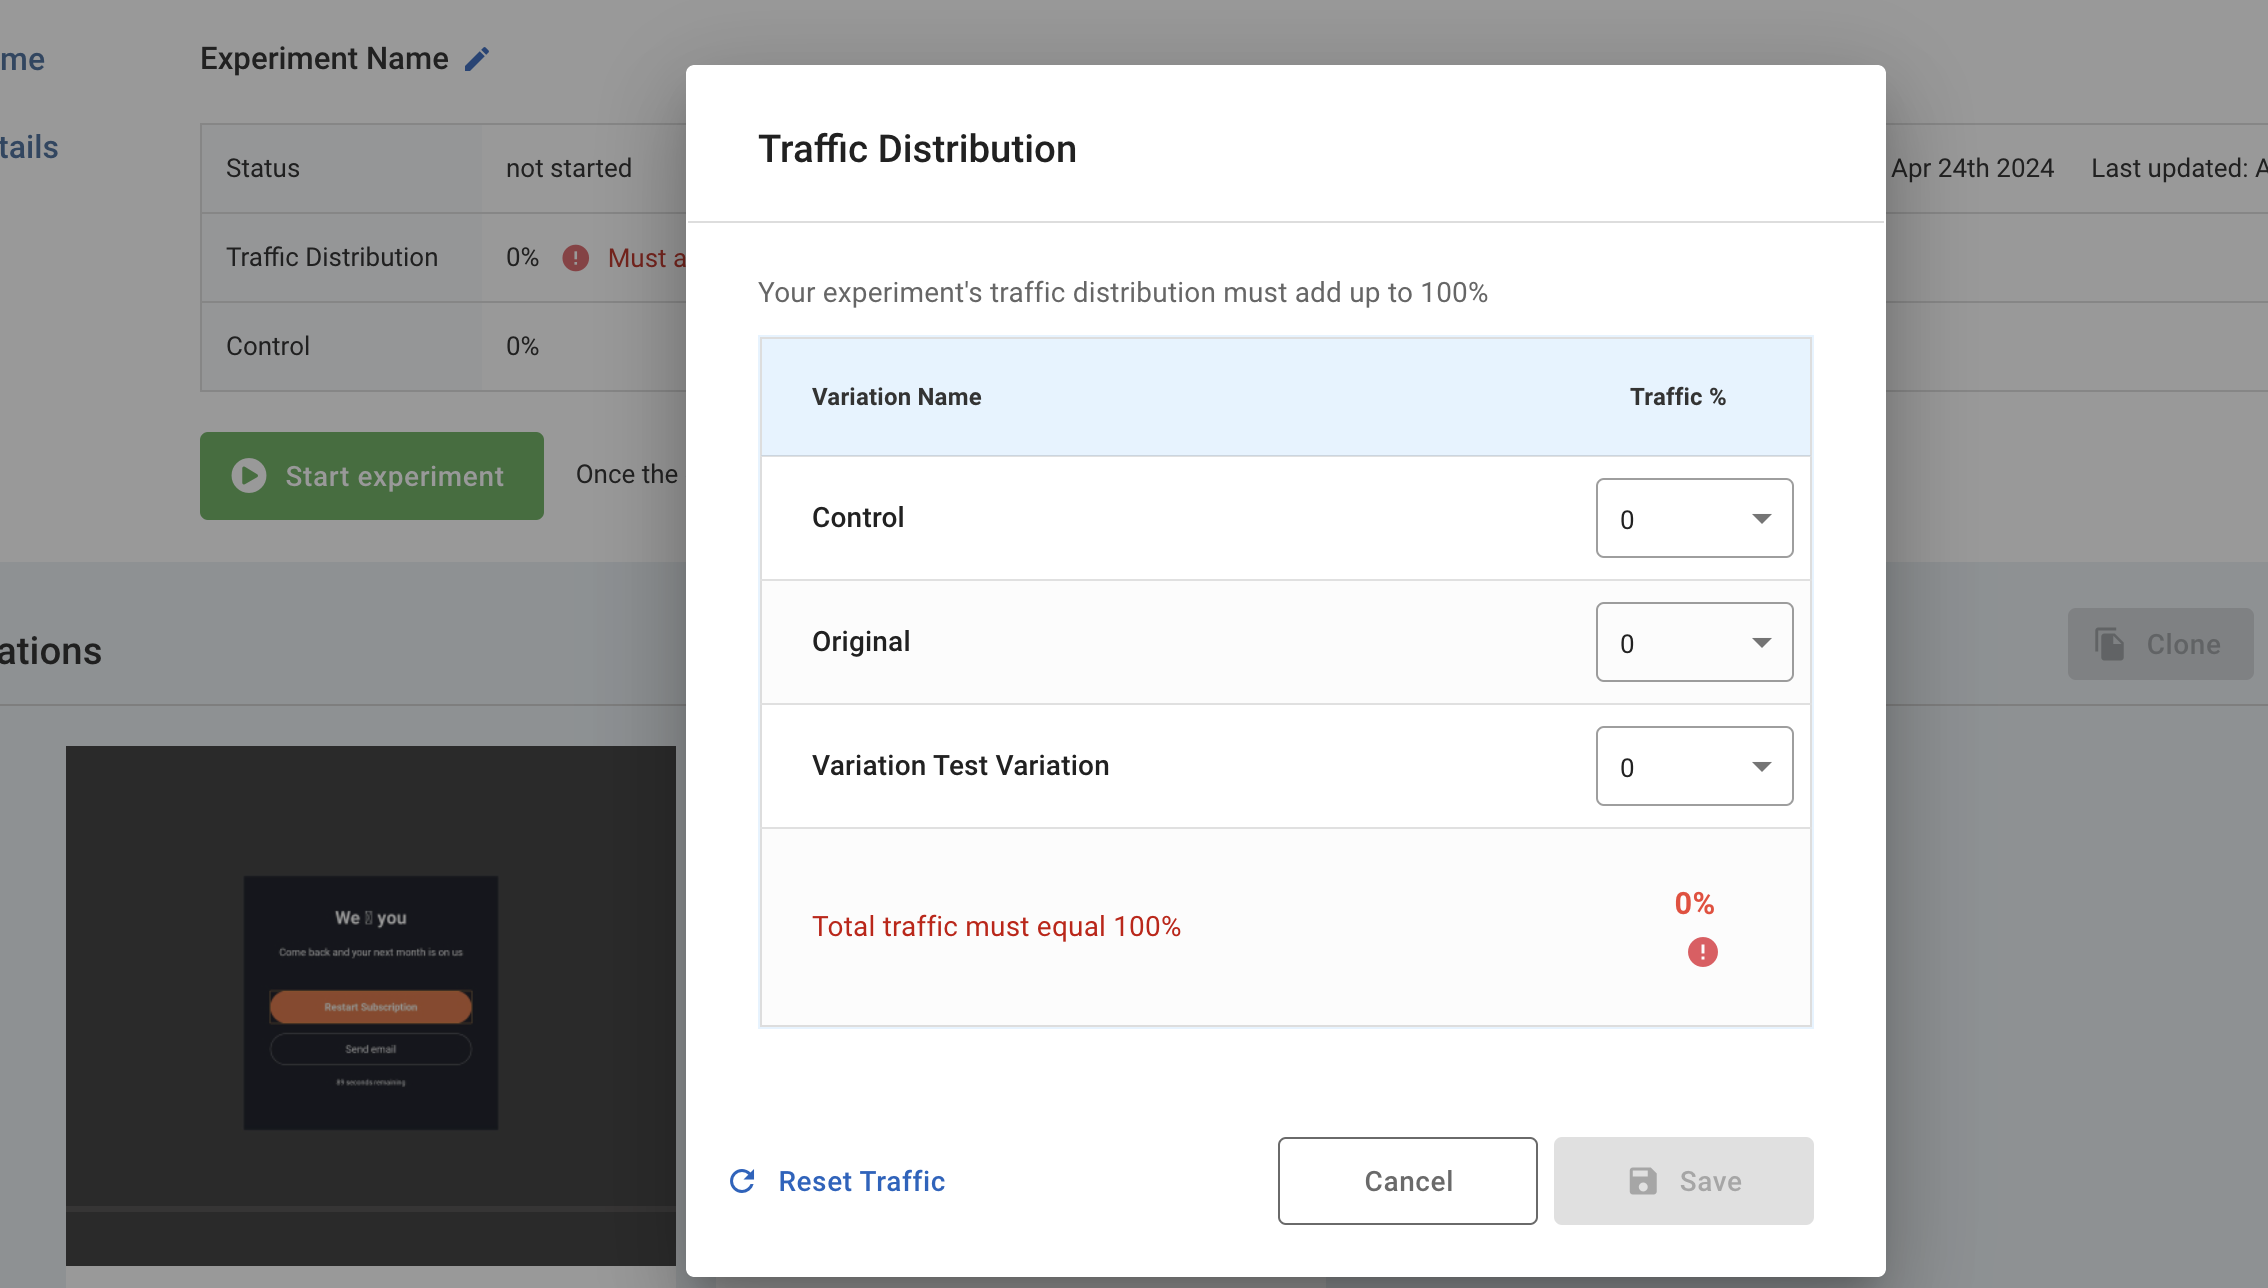
- Allocate traffic percentages to each variation and control, ensuring they total 100%.
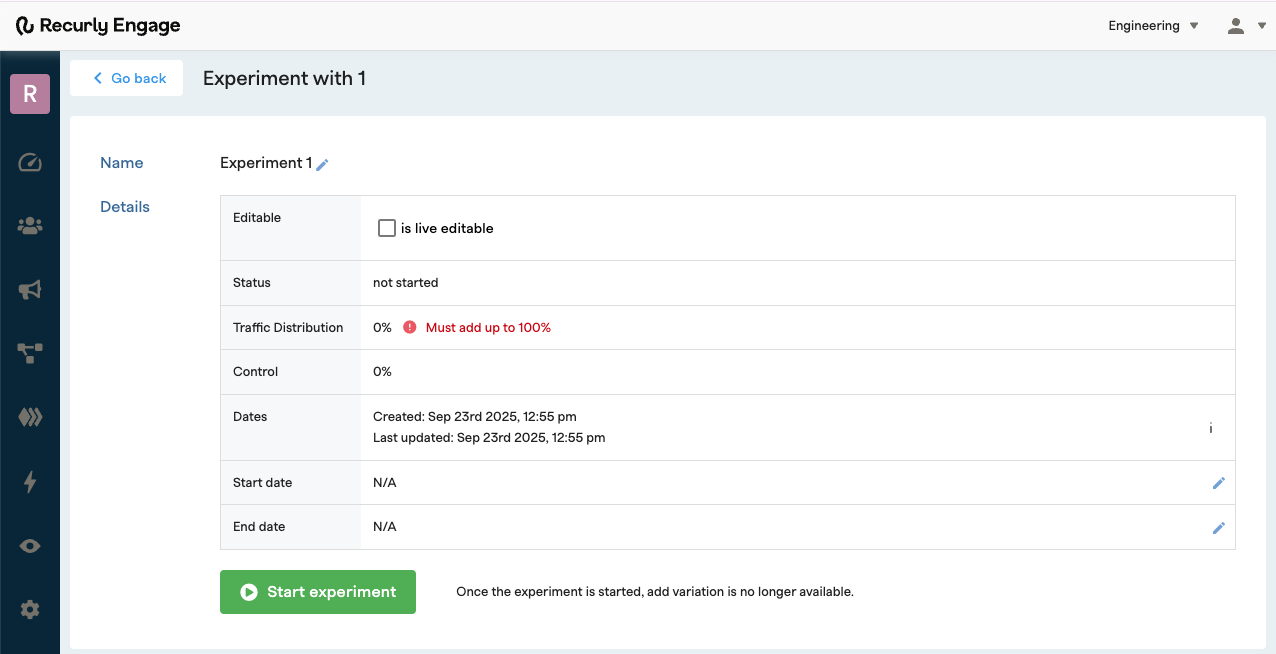
- Click Start experiment and confirm to begin dividing traffic.

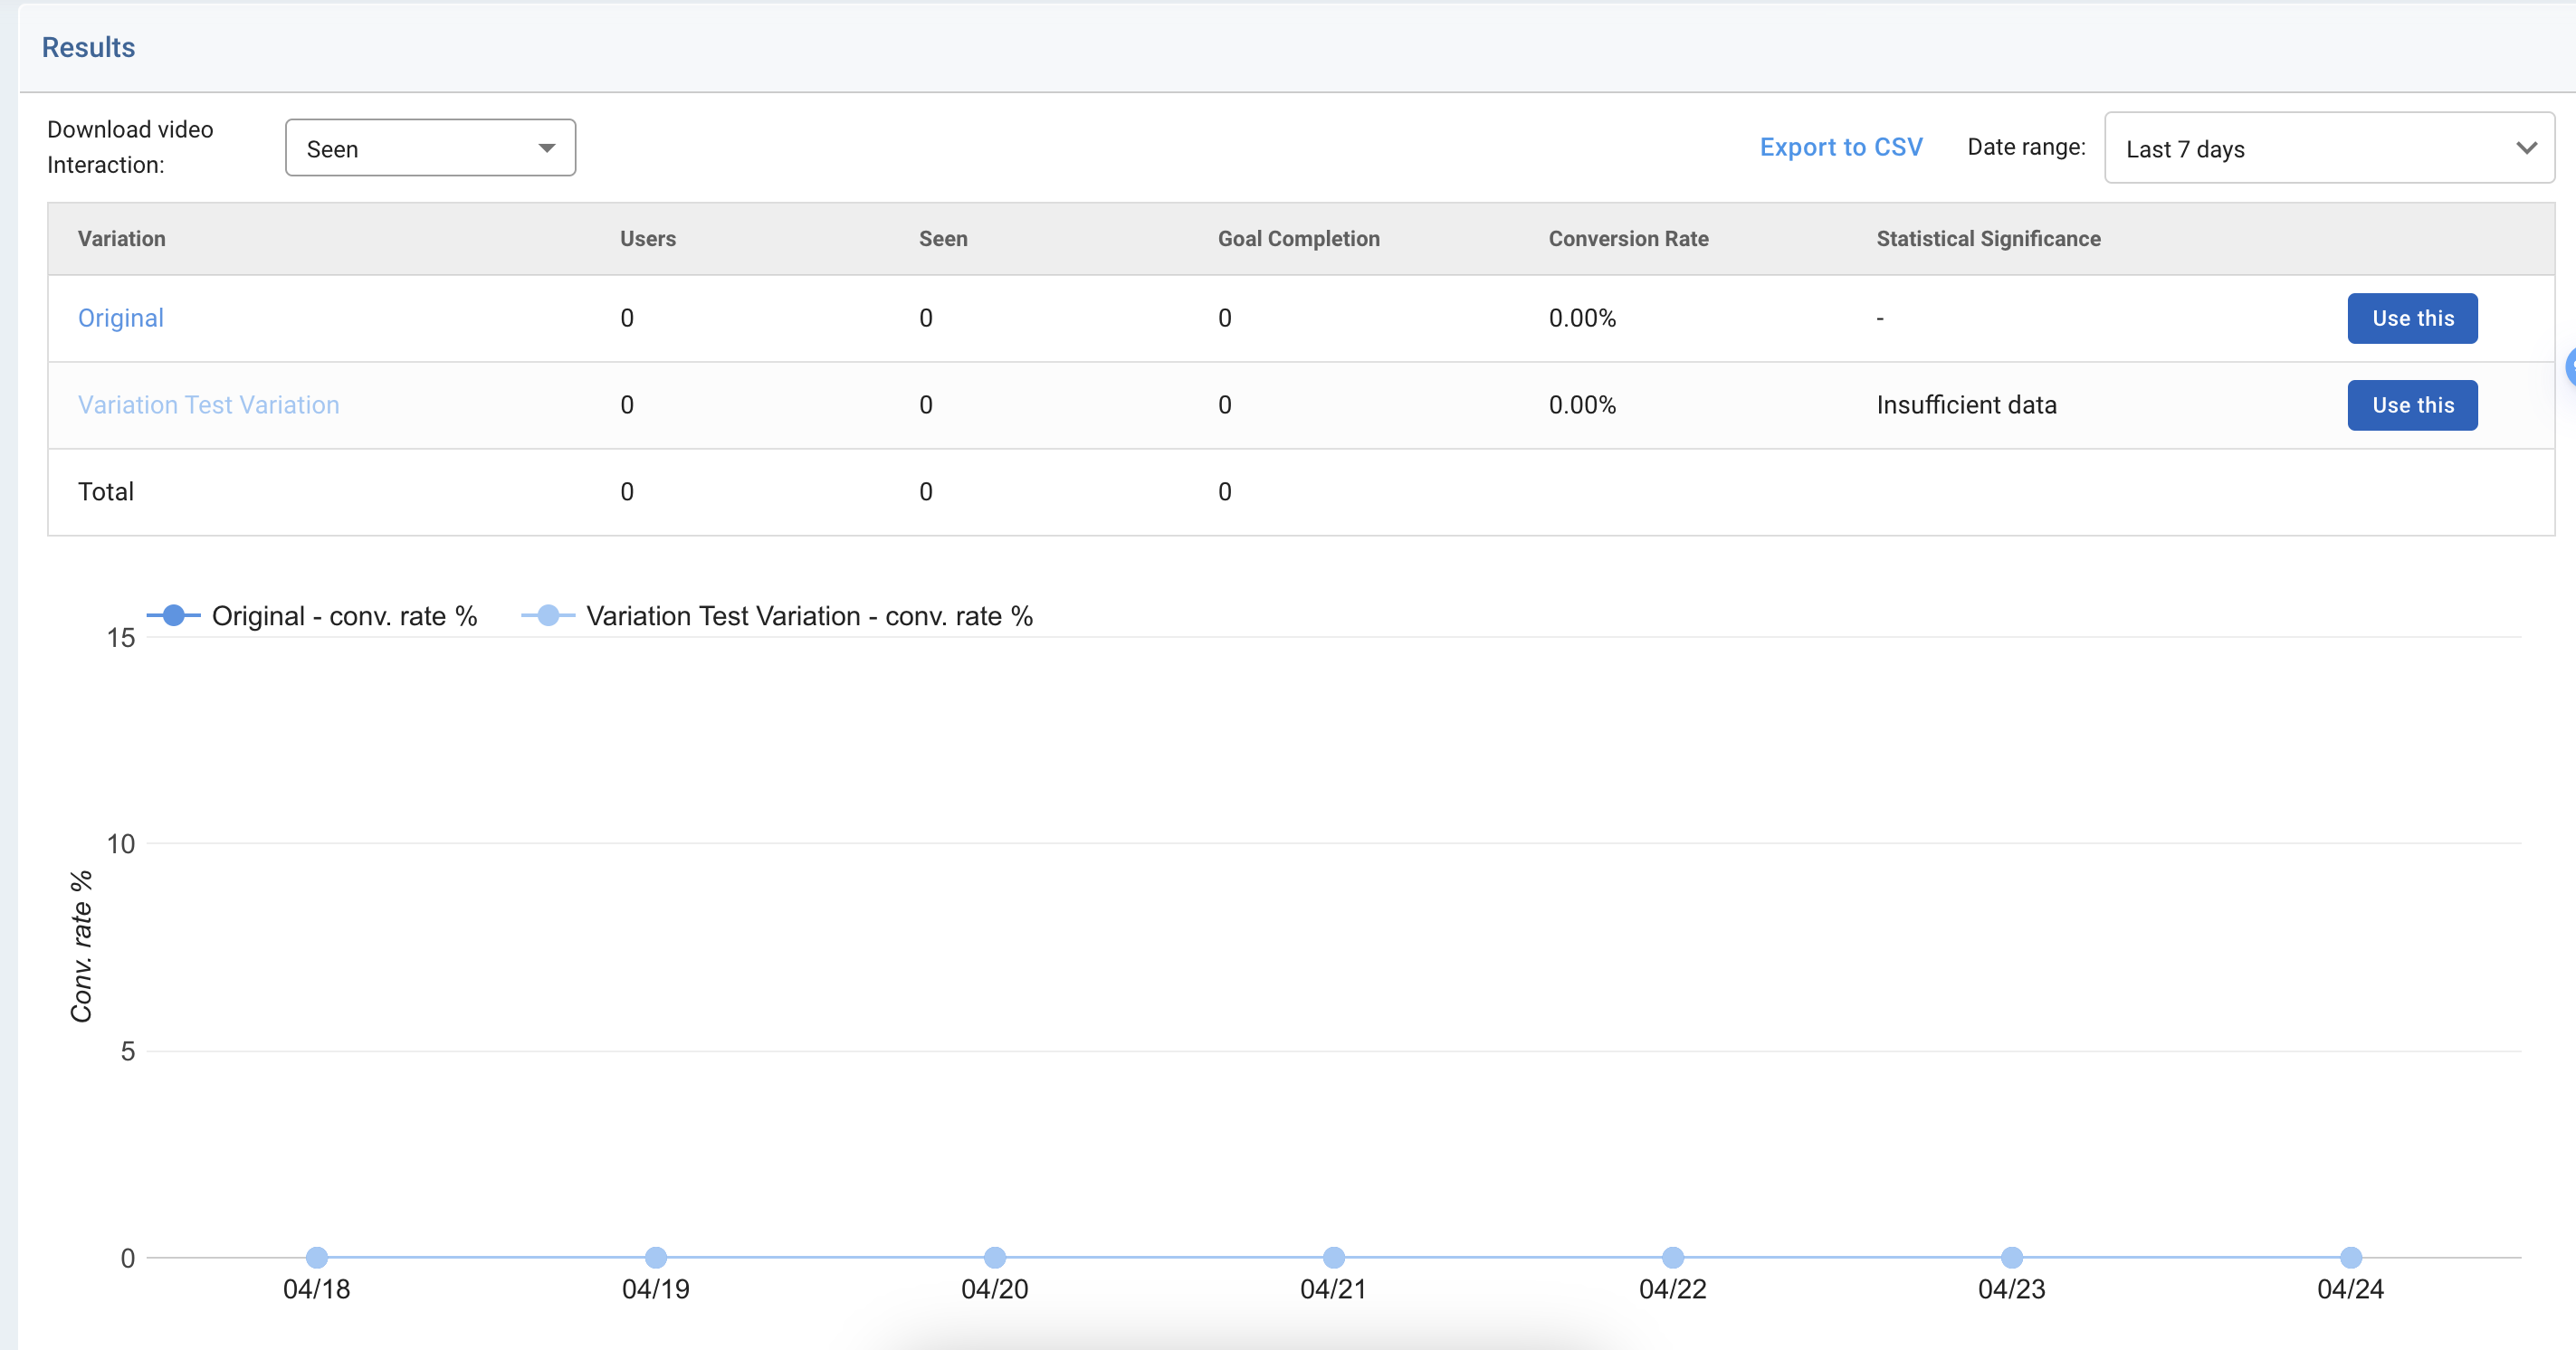
- Monitor in-progress experiments: view users per variation, conversions, and conversion rates in real time.
- When a variation demonstrates statistical significance, click Use This to end the experiment and promote that variation as your new baseline.
Edit live experiments
You can now make minor updates to a running experiment's variants, such as copy changes or action updates, without stopping and restarting the experiment. This can be useful for minor adjustments that are unlikely to affect the experiment's core metrics.
To use this feature, you must first enable the "is live editable" option when you set up a new experiment. This setting is disabled by default.
Once the experiment is live, you will be able to edit all editable variants, including the original variant's triggers and actions, directly from the main prompt screen.
Experiment reporting
Experiment reporting allows users to download a CSV file containing detailed data from their experiments. This feature is designed to help users analyze and report on experiment results.
Features include:
- Data Availability: Users can now export experiment data for a specific time frame directly from the Settings section of the application. The export includes data for both currently running experiments and any completed experiments that overlapped with the selected date range.
- Data Content: The exported CSV file only includes experiment-specific data. It does not include general prompt data. For completed experiments, the export provides the total stats for the entire duration of the experiment run. For running experiments, the stats are scoped to the specified time frame.
Updated 10 months ago