Hourly activation & churn
Dive deep into Recurly's Hourly Activation & Churn analytics for a comprehensive view of subscriber behaviors, trends, and growth patterns.
Overview
Required plan
This feature or setting is available to all customers on any Recurly subscription plan.
Prerequisites
- Users must have Analytics user role permission.
Definition
The "Hourly Activations and Churn" section of Recurly's Reporting & Analytics provides an operational overview of subscriber activity and trends, updated hourly. It offers insights into subscription signups and churn rates to help you make informed decisions.
Note: Subscriber counts focus on individual subscribers, not the number of subscriptions they hold.
For guidance on filter tools, visit our documentation.
Key updates on data freshness
- Dashboards are updated hourly, and data can lag up to two hours.
- MRR updates every two hours due to computational complexity.
- Dashboards include a timestamp at the bottom, indicating the data's last refresh time.
Exceptions and insights:
- Some reports can reflect data as recent as 20–25 minutes due to faster data lake refreshes (10–15 minutes). However, analytics mart processes introduce up to 1–1.5 hours of staleness before the next run.
- Dashboards have a four-hour cache. Merchants can clear the cache manually for more recent updates.
Key benefits
- Near real-time visibility: Gain up-to-date insights into subscriber activations, churn, and net growth.
- Trend analysis: Monitor subscriber behavior on an hourly basis and spot emerging patterns.
- Performance tracking: Compare daily data with past periods for actionable insights.
- Decision-making support: Use detailed metrics to optimize subscriptions and retention strategies.
Hourly Activation & Churn
Accessing Hourly Activation & Churn
Follow these steps to access and interpret this report:
-
Navigate to Subscriber management in the Reporting & Analytics menu.
-
Open the Hourly Activations and Churn dashboard.
-
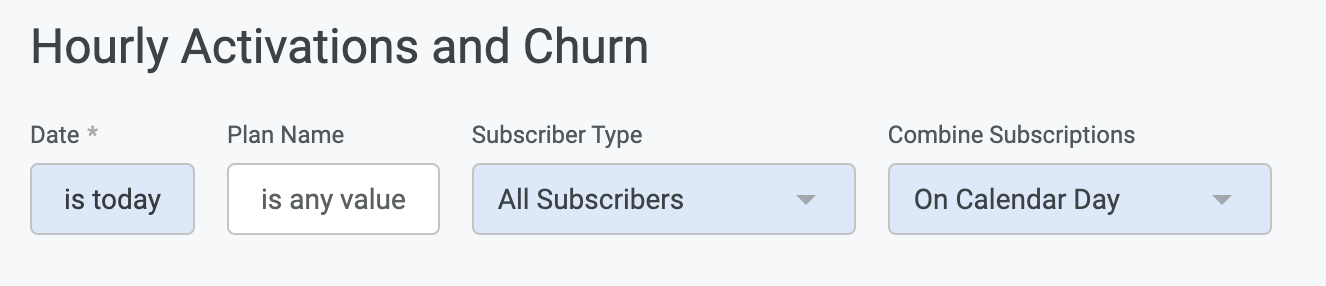
Apply filters to refine the data:
- Combine Subscriptions: Combines consecutive subscriptions for accurate metrics.
- Plan Name: Analyze data by specific subscription plans.
- Subscriber Type: Filter paying subscribers or trial users.
- Date: Select specific timeframes for deeper insights.
-
Review the four key widgets at the top:
- Subscribers Activated
- Subscribers Churned
- Net Subscribers
- Total Subscribers
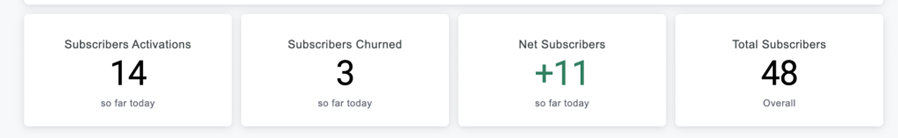
Click on widget numbers to drill into account-specific data.
-
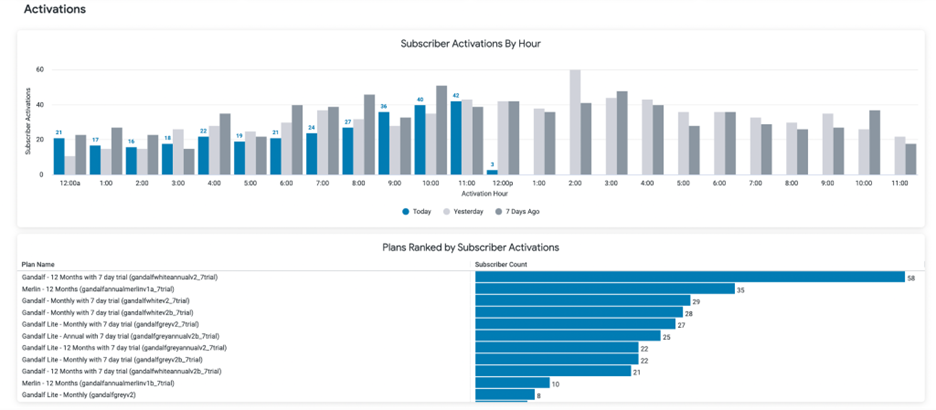
Analyze bar charts for Activations and Churn:
- Charts are interactive, providing granular account details.
Activations
Churn
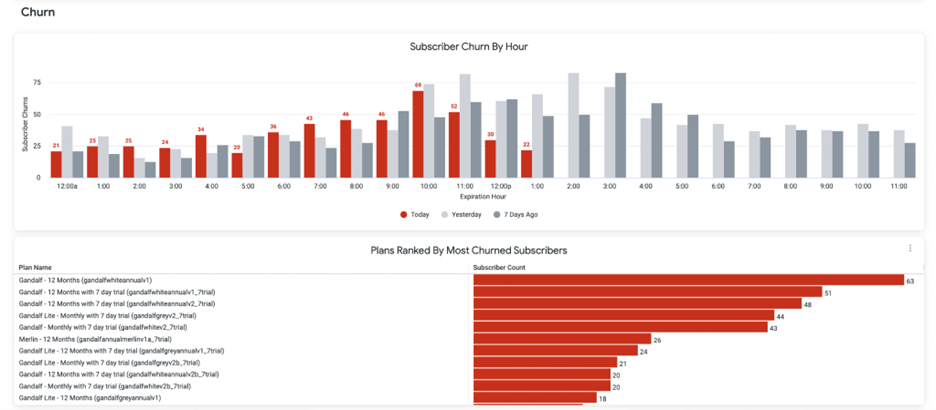
Pay attention to Plan Rankings for insights into plan-level performance.
Recommendations for real-time updates
- If merchants require faster updates, suggest leveraging webhooks to build a custom solution. While this requires significant development, it provides more control over data freshness.
- Emphasize the value of existing hourly updates for high-volume days or executive reporting.
By using these tools and insights, you can optimize subscriber management and align your strategies with data-driven outcomes.
Updated 5 months ago