
Accounts analysis
Dive deep into Recurly's Account analytics for a comprehensive view of account behaviors, trends, and growth patterns.
Overview
Required plan
This feature or setting is available to all customers on any Recurly subscription plan.
Definition
The "Account" section of Recurly's reporting & analytics offers a comprehensive set of reports and metrics to help you track and analyze account counts and trends. It provides valuable insights into your subscription signups, churn rates, and overall subscriber growth.
Key details
For additional guidance on navigating and utilizing filter tools, consult our documentation here.
Analyzing accounts
- Evaluate the net change in accounts over time to understand the overall growth or decline of the accounts.
- Assess the contributions of new accounts, returning accounts, and churned accounts to the net change.
- Identify any significant trends or patterns that can inform strategic decision-making.
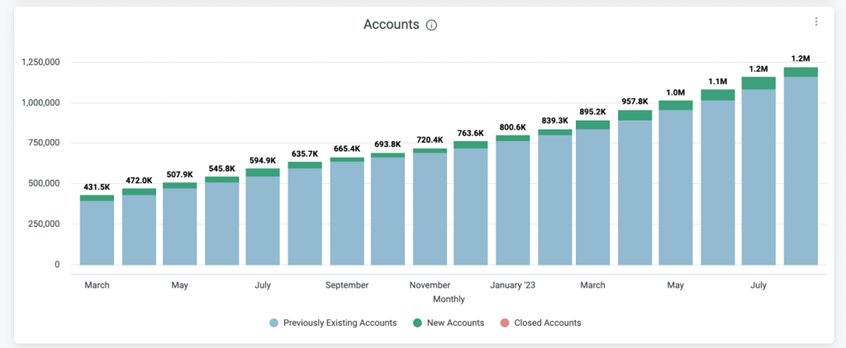
- This chart shows the number of open accounts over time. You can see the breakdown by previously existing accounts, new accounts and closed accounts.
- Previously Existing Accounts: Accounts that were created prior to the specific timeframe.
- New Accounts - Accounts: Accounts that were created during the specific timeframe.
- Closed Accounts - Accounts: Accounts that were closed during the specific timeframe.
- The number above each bar represents the total number of open accounts for the given timeframe.
- Hover over any point on the bar to view the number of accounts for the selected timeframe.
- Gain insights into the fluctuations in account counts and understand how the account base has evolved over time.
- Click on any bar in the chart to view the total number of accounts for the selected timeframe.
- Analyze the account trends and identify any significant changes or patterns.
- Use the interactive features of the widget to navigate through different timeframes and gain a comprehensive understanding of account counts.
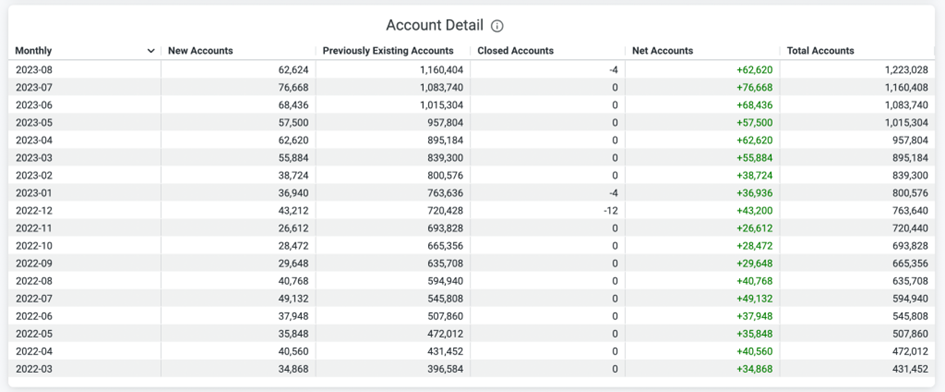
This table is a representation of the chart above, it shows the specific number for each timeframe and account group as well as the net and total number of accounts.
Updated 3 months ago