
Payment processing
Monitor payment success rates and decline patterns across payment methods, gateways, and card BINs in the Payment Processing dashboard.
Filters
| Filter | Description |
| Date Range | The reporting period. Defaults to the past 30 days. |
| Payment Method | Filters by card or alternative payment type (Credit Card, Debit Card, PayPal, and more). |
| Gateway | Filters by payment gateway. |
Key metrics
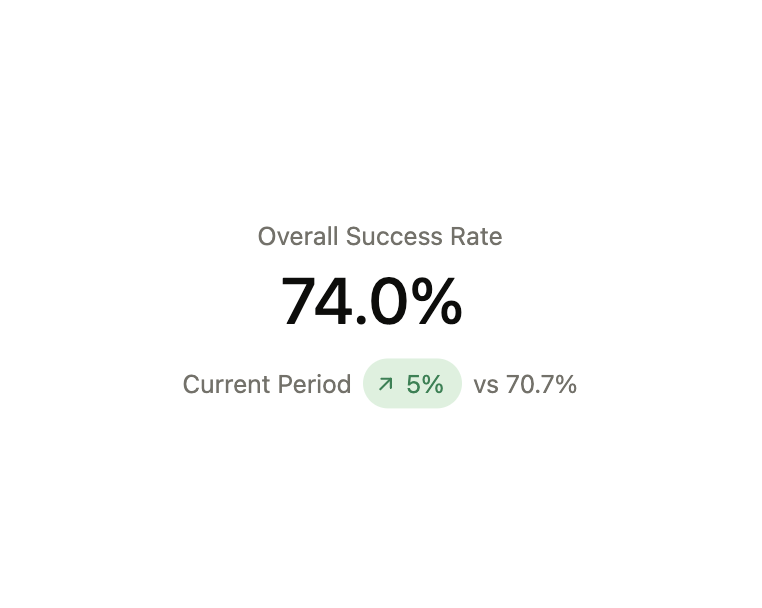
Overall Success Rate — the percentage of transactions that succeeded across both customer- and merchant-initiated payments during the selected period, compared against the previous equivalent period.
Charts
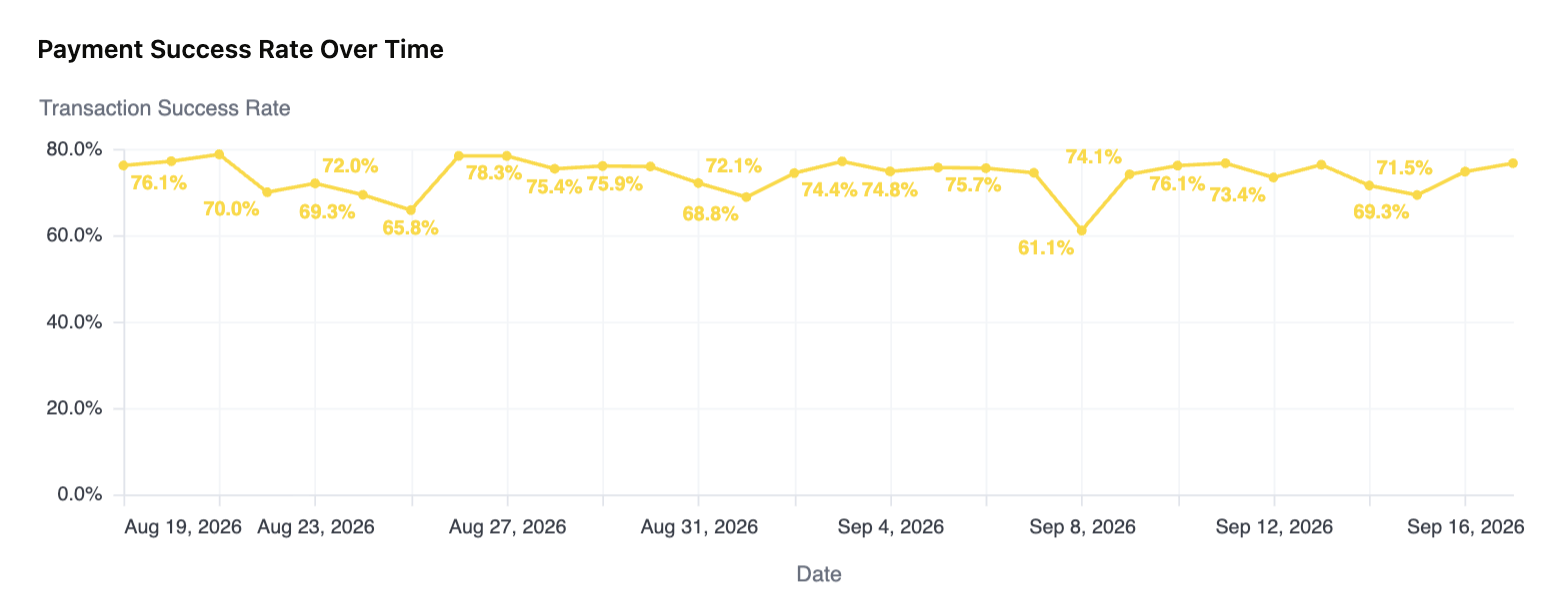
Payment success rate over time
This chart shows your transaction success rate across the selected date range, so you can track performance trends and identify periods where success dipped.
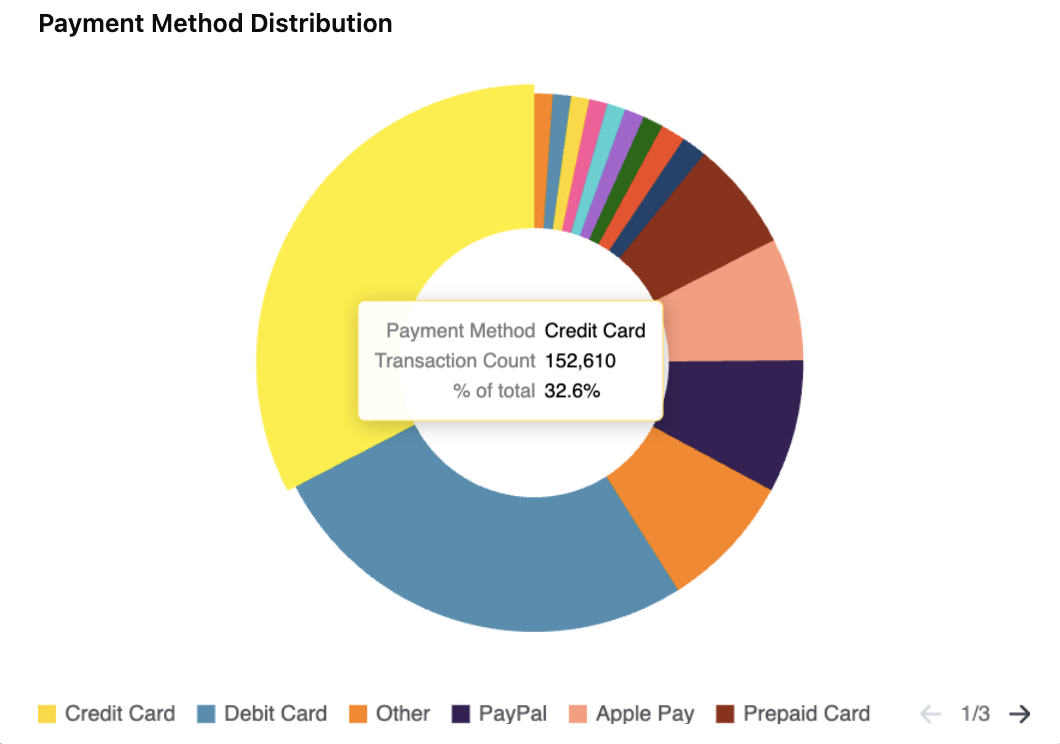
Payment method distribution
This chart shows the relative share of transaction volume by payment method, so you can see which methods your customers use most.
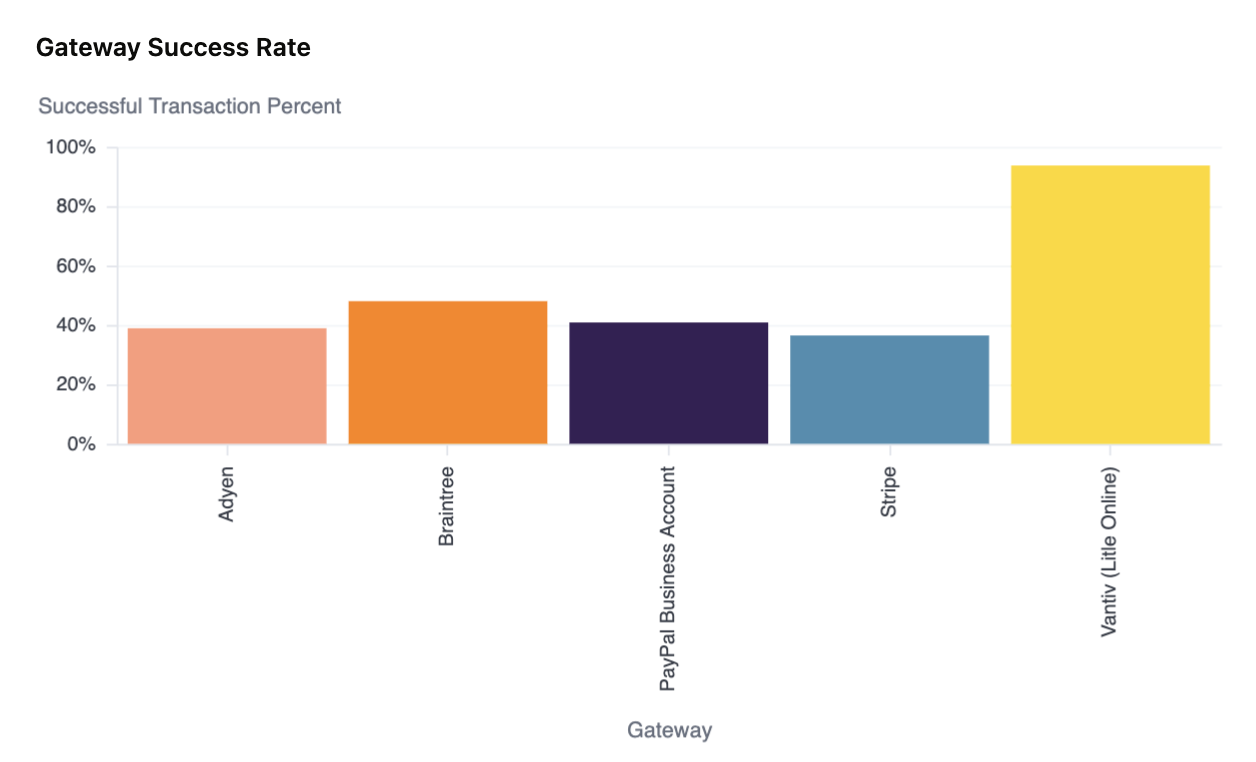
Gateway success rate
This chart shows the successful transaction percentage for each payment gateway side by side, so you can compare authorization performance across your gateways.
Tables
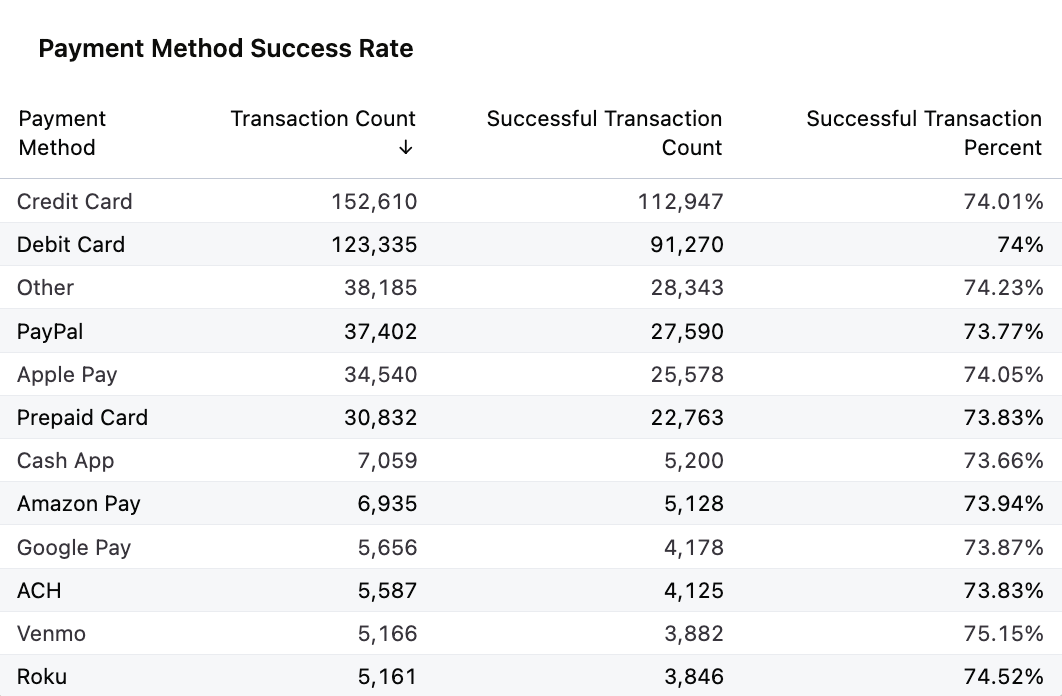
Payment method success rate
Breaks down performance by payment method, showing the transaction count, successful transaction count, and successful transaction percentage for each.
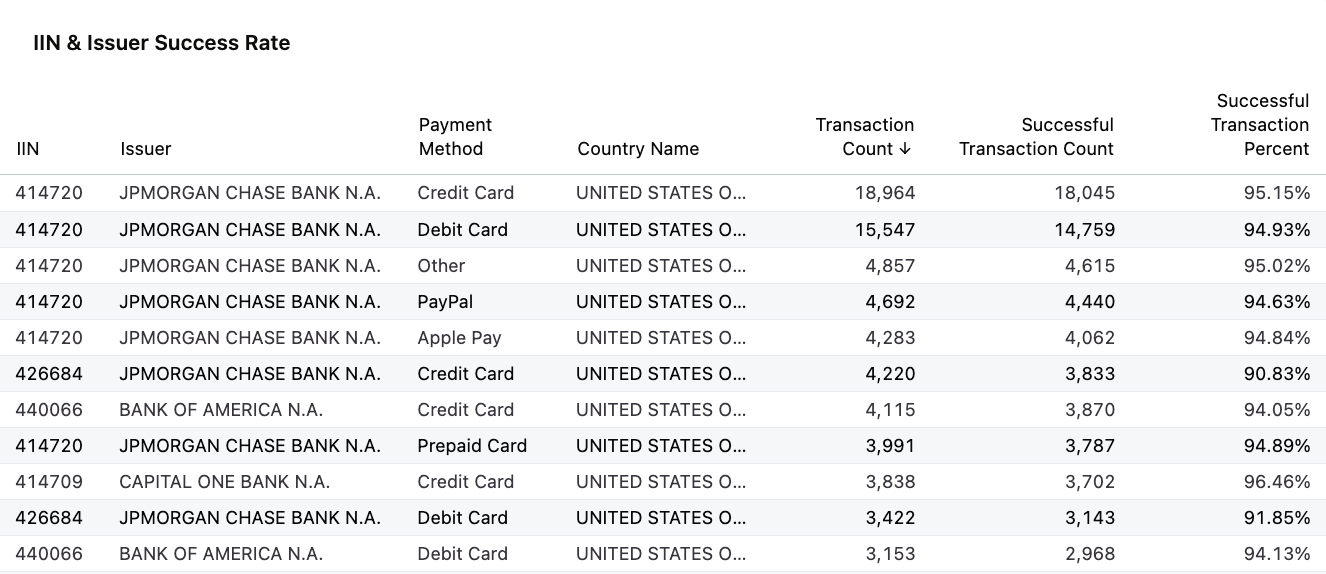
IIN and issuer success rate
Shows authorization performance by card BIN — the Issuer Identification Number (IIN) that identifies the issuing bank — alongside the payment method, country, transaction count, successful transaction count, and successful transaction percentage. Use it to identify underperforming issuers.
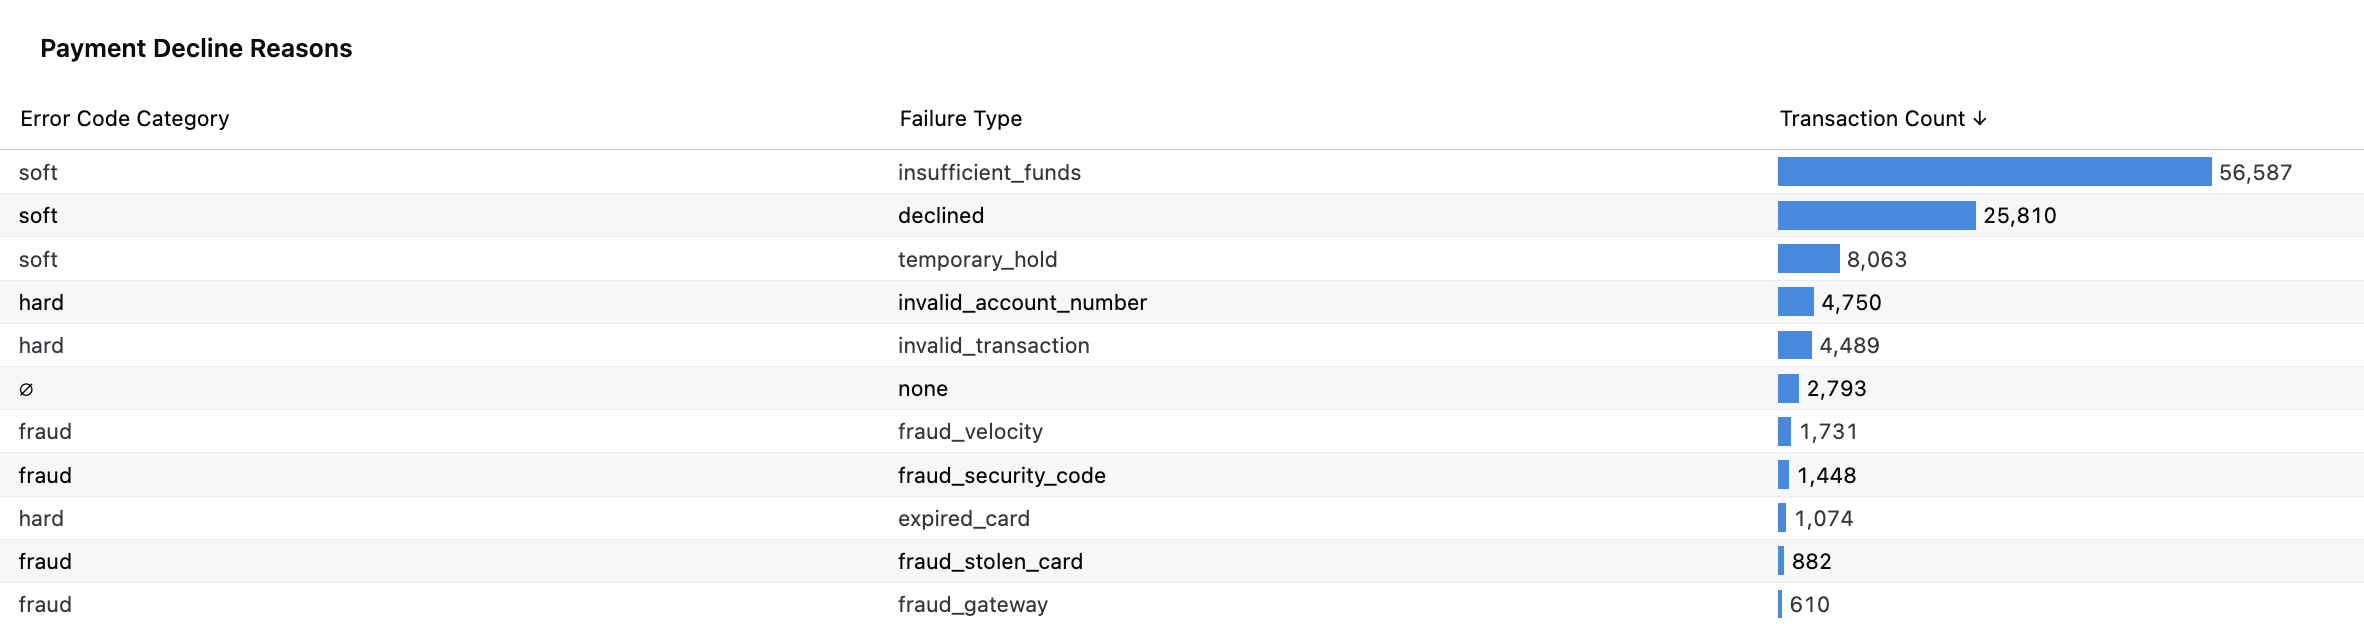
Payment decline reasons
Ranks the reasons transactions failed, categorized as hard, soft, or fraud declines, with the count for each failure type. Soft declines often represent recoverable revenue through retries or account updates, while hard declines signal issues that require more targeted intervention.
Updated 26 days ago